Saturday, April 30, 2011

RIMM (& FCX): Fundamental Research In Commotion

(Click on charts to enlarge, then click on them again for further enlargement. Use left arrow on your browser for further enlargement).

Yesterday, on the Yahoo FCX Message Board, I made the following statement:

"...The only thing that matters to me about fundamentals is the market's REACTION to them, that I can see in a chart. Analysts' opinions about what a stock "should be doing" doesn't signify with me.

One of many, many examples of why I feel that way: ... thread here this morning on US Steel (X)."

In this second decade of the 21st Century, the general response that I have received over the years, and continue to receive, to my work as a technical analyst absolutely astonishes me. Statements like, "You have to be a moron to waste your time like that on stupid charts." Or, "Technical analysis is totally useless." Or, "Technical analysis doesn't WORK."

Work? Well, no-o-o. How can something that is not human perform work, and why would anyone have that expectation in the first place?

Sadly, that ignorant attitude has been promoted by the reigning "Guru Du Jour" on television who, until recently, has been a devout technical analysis atheist. In the winter of 2011, this particular guru (who I think actually is a genius, and who I think is enormously entertaining) finally did a program entitled "The Fundamentals AND The technicals," for which I applaud him. When I say "ignorant," by the way, I simply mean "not knowing," not anything hurtful to another person, although given the nature of some of the incredibly nasty responses to my work that I have received over the years, if anyone wants to interpret "ignorant" in the pejorative sense of the word, it wouldn't be inappropriate ;)


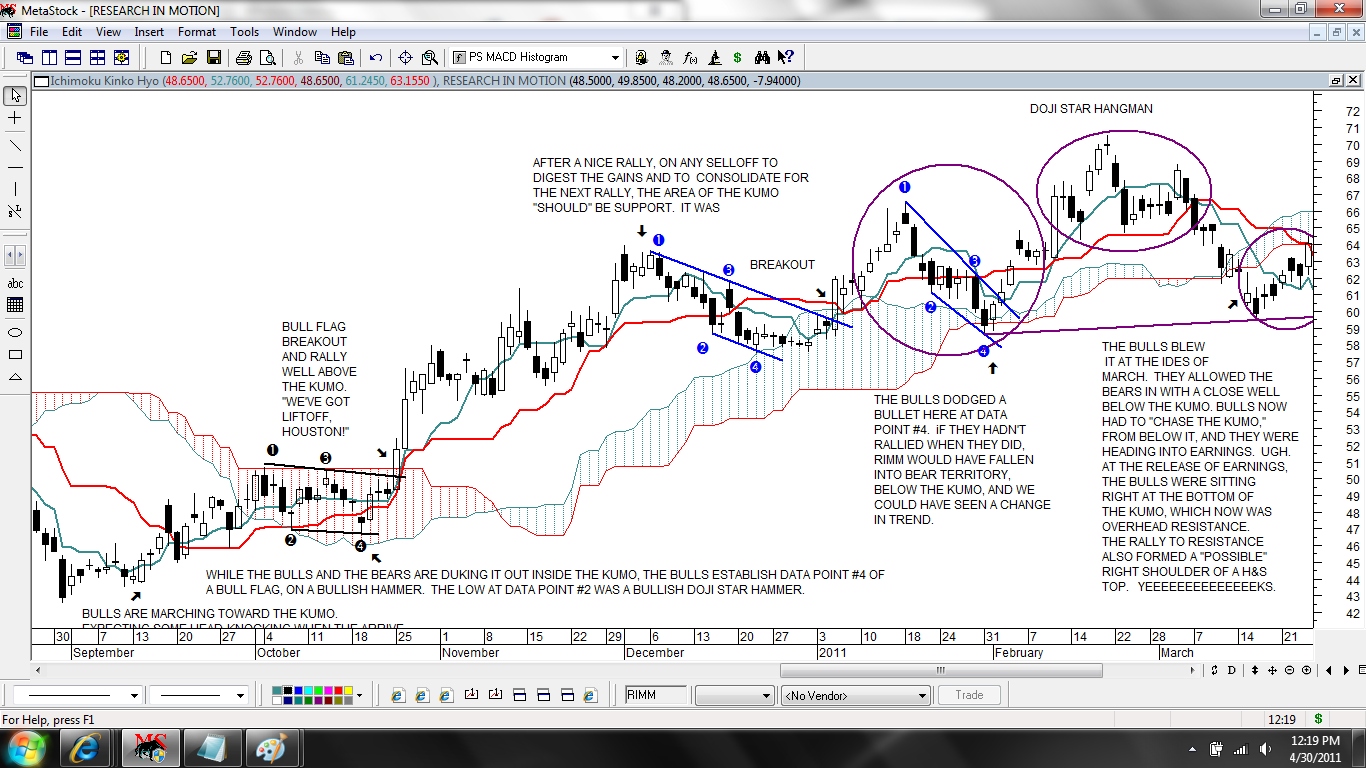
For review, if anyone would like, see my April 2 post: "RIMM: Research In Commotion."

Chart is self-explanatory. Ahead of earnings, "Trading Buddy" (my idea for a technical analysis software program) had laid it out for us, and would have asked us, "SELL, or HOLD?" through the release of earnings.


The market's RESPONSE to earnings, despite at least three analysts having targets of $80, $90, and $110 based on their views of the fundamentals, was to gap RIMM down, below the neckline of a H&S Top, at which time "Trading Buddy" would have asked us, "Do you want to SELL or HOLD a technical breakdown of a three month H&S Top that has a downside target of 47.57 IN PLAY?"

We don't need "Trading Buddy" to ask ourselves, "The fundamentals are telling me that RIMM 'should be' priced above $80, according to at least three Wall Street analysts, but what I'm actually SEEING is a serious technical breakdown in the stock. Hmmm-mm...what should I do?"

After the closing gong on April 28, RIMM reduced Q1 guidance and the response of at least five analysts (early tally) who had been looking at the fundamentals and completely ignoring the serious technical breakdown in the stock, downgraded it. UGH.

Notice how "the analyst game" is played. The price quoted in the following report of the RBC downgrade (they had a target of $90) is $56.59, NOT the April 29 opening price of $48.50 that "Joe Investor" got if he sold the open on all of the downgrades. For purposes of "performance numbers," by which the analysts' recommendations are measured, that probably is how it will go into the books, at $56.59, since I've seen things get reported that way.

Research in Motion (RIMM: Nasdaq) By RBC Capital Markets ($56.59, April 29, 2011)

"We are downgrading Research in Motion to Sector Perform (from Top Pick) and reducing the price target from $90 to $55.

Our prior Top Pick rating for Research in Motion (ticker: RIMM) was based on the following: 1) fundamental value was not reflected in eight times valuation and; 2) new products restoring momentum and investor confidence.

We were wrong, as misexecution has undermined sentiment recovery. Our Sector Perform rating reflects our view that Research in Motion shares will likely remain pressured pending improved investor visibility on the ..."

The article was cut off there. Pay if you want the rest. "Um-m, no thank you."

This, from the article's Comment Section:

12:00 am ET April 30, 2011

Jeffrey L. Pritchard wrote:

"This was funny to me. Kind of makes research seem useless."

Gosh, I felt for that poor fellow. We've all "been there...done that" and know how lousy he feels. Let's not call anything "useless," but if anyone wants to insist on calling something "useless," readers can decide whether it was the technicals or the fundamentals. Personally, I don't want to call anything useless. It might be useful to someone else, and let's respect that. The analysts' opinions on their view of the particulars of the fundamentals, like the eight times valuation that they mentioned, just aren't useful to me. Let me say again, as I said yesterday:

"...The only thing that matters to me about fundamentals is the market's REACTION to them, that I can see in a chart. Analysts' opinions about what a stock "should be doing" doesn't signify with me."


We saw this breakdown of the H&S Top in US Steel, AND the failed retest of the breakdown of the neckline, prior to the release of earnings (see past posts on X).

The day after US Steel spent the entire session selling off after the release of earnings, Goldman downgraded it, from $72 to $56. We won't speculate about the possibility of Goldman selling off their shares of X during that selloff session, prior to letting their clients know about their downgrade, because that might not seem polite. We'll choose to think well of Ol' Goldman, and choose to feel certain that they allowed their clients to get out of the stock, prior to selling their own holdings after their downgrade ;)


FCX continues with its post-earnings recovery. Anything above KEY SUPPORT, "it's all good." It's a healthy digestion of the gain off the 49.71 Smackdown Low, and it's healthy backing and filling, working off the "overhang of sellers" in the stock, which we've discussed. Ideally during this backing and filling phase, the "weak-handed longs" will be worked off (they want out at a break even, and they're selling here), and the remainder of the longs who have been trapped at higher prices will hold, expecting higher prices in the stock. That's the "ideal" situation, not a prediction. I try to FOLLOW the stock, as best I can.

In keeping with today's topic ...


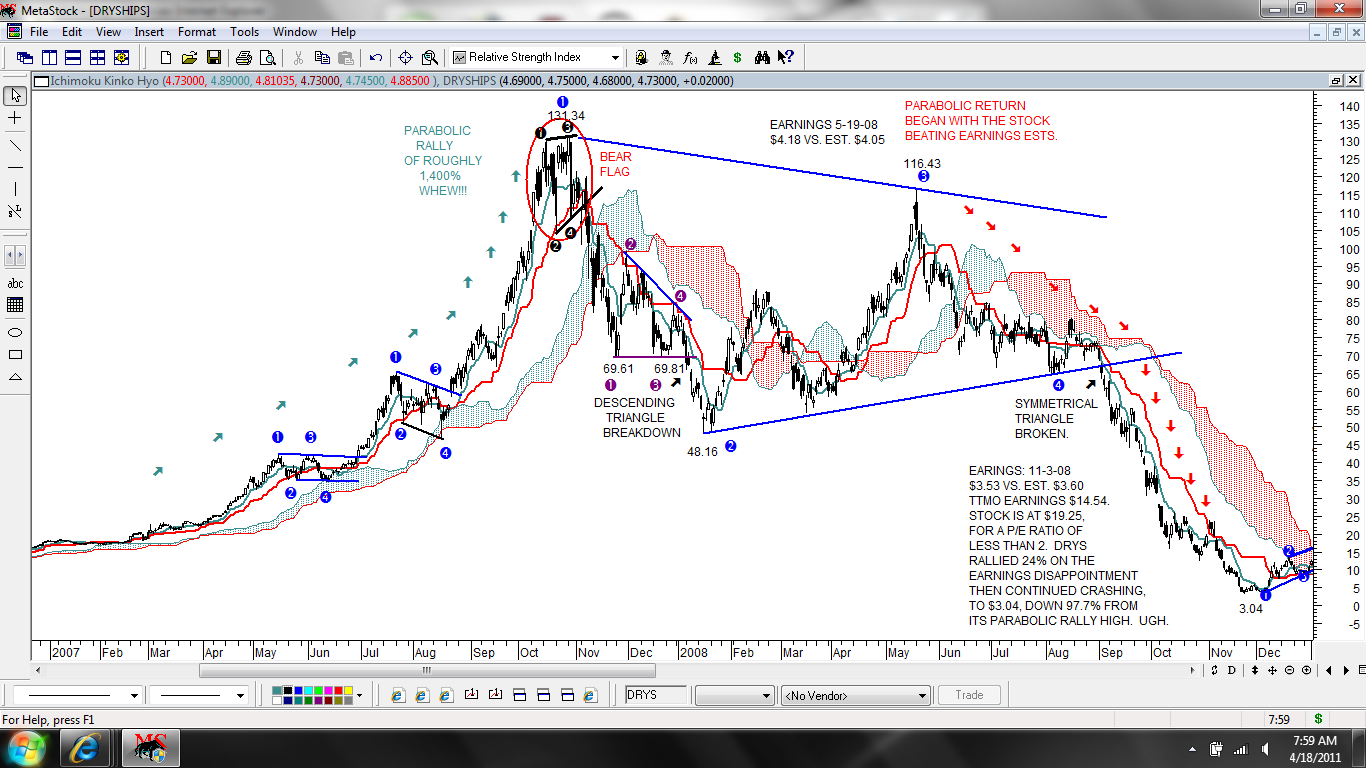
... sorry if this chart is a painful reminder to anyone who was long FCX through this horrific crash, but let's not forget the recent past in FCX.

(Paraphrased): "Unless we know/learn from history, we're destined to repeat it."

We can rest assured that in the Spring of 2008, there were bullish things being said about the fundamentals of FCX when it was trading in the 50's and 60's. But, we can see from the various technical breakdowns in the chart where things weren't looking so bullish.

Summary Comment: If anyone who has read this post still can tell me that technical analysis is "totally useless," I give up, not on technical analysis, I give up on trying to help that particular person to come out of his or her ignorance.*

*I mean "ignorance" in the nicest sense of the word possible, with hugs thrown in, wiping spew off a chin or two, and all of that good stuff ;)

Friday, April 29, 2011

Goldcorp (GG): Target Practice


GG printed at least a 10-year high yesterday, at 56.20, then reversed and finished the session on an Inverted Hangman candlestick. Those aren't necessarily bearish. Look at the Inverted Hangman in February, just after GG broke above the Kumo. The next session was a black "Gap and Crap" candlestick, followed by a white one, then another black "Gap and Crap" candlestick, then GG took off to the upside. So, we don't want automatically to decide that yesterday's candlestick was bearish.

When a pattern breaks out or breaks down, I like to see the stock get to the target, or reasonably close, in at least the same amount of time that it took for the pattern to form. Sometimes, the target comes in late, but my feeling is, if this was a bullish (or bearish) breakout of any significance, what's the stock doing dawdling around and NOT getting to the target? I cases of "dawdling," I usually reduce my expectations.

The recent Ascending Triangle took seven days to form and breakout. Today is the seventh day since the breakout. Although GG got to within five cents of the Double Bottom target of 56.25 yesterday (see next chart), it's still well below the Ascending Triangle target of 57.23 in this daily chart. It's not only "dawdling," it had two "knuckle-biter" session on Wednesday and Thursday, where it traded back below the top of the Ascending Triangle. GG is back above the Symmetical Triangle, but it gets point deductions from its score for Technical Merit for both the "knuckle-biter" sessions and for the "dawdling."


The "knuckle-biter" sessions in the daily chart were caused by the morphing of the Third Ascending Triangle (pattern in yellow) into the Rising Wedge (pattern in red) that subsequently broke down at the red arrow. Whatever upside target was IN PLAY (I forget) on the Ascending Triangle breakout got CANCELLED right there at the red arrow. The Rising Wedge breakdown was "THE TELL," that the bullish Ascending Triangle wasn't bullish at all. It was a Fakeout/Breakout.

After the initial selloff, GG went into a Rising Channel/Bear Flag (pattern in blue). That broke to the downside, too. Yeeeeesh.

GG put in a low at 53.75, rallied to the 55.02 gap (white down arrow), and failed right there, confirming the gap as validated resistance. Yeeeeesh.

The next selloff was to 53.75, for a "possible" Double Bottom. Everything that GG did from the Fakeout/Breakout high (top of the red pattern) to this point was bearish. Often, in order to turn the situation around, stocks will have Fakeout/Breakouts (the pattern in red) and Fakeout/Breakdowns (the first white arrow) in order to get the proverbial everyone "wrong-footed," to get things started for a reverse in the other direction. Players have been lulled to sleep, as it were, saying, "Yes, that's bearish...yes, that's bearish, too...okay, the takeout of the 53.75...53.75 Double Bottom definitely is bearish, too ... we know the drill now..."

Oops! FAKEOUT/BREAKDOWN!!! (first white arrow).

That's the start of "Buying Begets Buying." Bears who have been short, or who shorted the Double Bottom breakdown see that they need to BUY to cover. Bulls see the quick recovery off the Fakeout/Breakout low, so they BUY as well.

The Bulls' first order of business on the ensuing rally was to knock out validated resistance at 55.00 (white down arrow), which they did. In addition to being validated resistance, 55.00 also was the pivot of the "W"-Bottom, or Double Bottom. Once that was taken out, we got 56.25 IN PLAY.

Math for the Double Bottom target:

55.00 - High of the pattern
53.75 - Low of the pattern (I use the more conservative number, so NOT yesterday's 55.66 low)

55.00 - 53.75 = 1.25 of upside, added to 55.00
55.00 + 1.25 = Target: 56.25 IN PLAY

Yesteday morning, GG opened higher, came back to 55.00 establishing former validated resitance as validated support (quite nice), then took off toward the target IN PLAY.

From the April 25 Comment Section:

"We can learn a lot from observation. I've observed, for example, that if roughly 75-80% of a target gets MADE very quickly without much pullback, that often is a good place to take profits, and re-enter at a lower price with achieving the target, or close to it, still in mind."

Yesterday's morning rally was very nice, but given the point deductions in the scores for Technical Merit and the fact that GG got to 75-80% of the target so quickly, I sold at the 75% marker.

75% of the 1.25 points that were IN PLAY is 0.9375 points, added to the breakout above 55.00 = 55.9375.


If the 56.25 target had gotten MADE, I would have "left some on the table" by selling early. But, we can see that if I had NOT sold early, I would have had the stock back in my face at the close, so that works both ways. In this case, since GG al-lmost got to the target and, again, because of the points deductions, I didn't "... re-enter at a lower price with achieving the target, or close to it, still in mind."

I didn't know when I purchased GG that I would posting on this trade (I normally don't post trades, other than the FCX trades that I've posted for learning purposes), so I don't have a screenshot of it. What I made on the trade isn't important anyway. What is important is understanding that targets just are "what we're aiming for," and understanding some of things that need to be considered when deciding where to take profits.

Thursday, April 28, 2011

US Steel (X): Reaction To Earnings


(Click on chart to enlarge, then click on it again for further enlargement. Use left arrow on your browser to return to the narrative)

Trading Buddy: Good Morning, Melf!

Melf Elf: Wow...did you ever call tha-at right! US Steel failed the neckline retest and has made a new low after the release of earnings.

Trading Buddy: Where in the world did you get the idea that I "called" anything?

Melf Elf: Well, you predicted...

Trading Buddy: Melf, stop. Listen to me. I don't "call" anything. I don't "predict" anything. I describe for you any patterns that I detect, and I describe for you what that pattern breakout or breakdown suggests.

Melf Elf: Then you predict what will happen next, like US Steel is going to 40.39 on this H&S Top breakdown?

Trading Buddy: That's not a prediction, Melf. It's a measured move that is IN PLAY, based on what the patterns breakdown suggests. I'm not predicting that it will get MADE. We are trying to FOLLOW the market, as best we can. We're not trying to "predict" it. Do you understand?

Melf Elf: Yeah, I guess so.

Trading Buddy: Do you feel that your understanding on this topic of "predicting" is now complete?

Melf Elf: Oh-h, definitely! I understand that you are a COMPLETE JERK FACE.

------------------------------------

Tongue-in-check aside, we can see that Melf Elf very much wants "Trading Buddy" to TELL HIM the answers. He wants "predictions" about the future that always are reliable, and that he can "take to the bank."

In my view, all of the "predicting" that goes on is perfectly fine, but what we really need to focus on is what we actually are seeing, as of that last candlestick on the chart." Not what we want to see, based on some prediction, but what we actually are seeing. And, we need to focus on, if we're going to make a play, what is our trading plan? An example of that follows, below.

From my April 23 post, pre-earnings:

"Personally, based on how badly positioned US Steel is heading into earnings, I'd have to TAKE THE MONEY and sell it. That isn't advice, or a recommendation. I don't advise or make recommendations."

Like Trading Buddy, Melf Elf certainly didn't predict anything about how US Steel would react to earnings. US Steel "could have" reacted differently, and moved higher. In fact, immediately after the release of earnings, the stock was indicated to gap higher, above 52.00, in pre-market trading given the fact that Q2 earnings looked hopeful.* If the stock had rallied back to the neckline after the release of earnings, I would have shorted it based on the likelihood that it would NOT be able to get back above the neckline, and if it did, it would NOT be able to take out the recent failed retest high of 53.82. My reason for that was that The Bulls were not favored in any bid they made to go up against a broken 4-month H&S Top.

If it did take out the 53.82 high, I would have stopped out the trade (taken the loss), and would have moved on to the next trade. We always are going to have trades that don't work out. Limit the losses, and move on.

* "Bear moves/Bear markets descend on a cushion of hope."

Wednesday, April 27, 2011

FCX: Post-Earnings Recovery


(Click on charts to enlarge them, then click on them again for further enlargement. Use left arrow on your browser to return to the narrative).

Since re-establishing, at the release of earnings, that they own the neckline of the Inverse H&S neckline, near 53.00, The Bulls not only went up and filled the 55.06-55.44 gap, which was their next order of business, they tacked on some extra yardage yesterday by taking out, and closing above, the gap-filling high of 55.79.


It's all good in this price area, back and filling, while working off the "overhang of sellers" that we've discussed.


The breakout of this Bull Flag, and subsequent "screamer" to the upside was quite nice. If The Bulls had taken more of a rest after rallying so nicely off the 49.71 low, it would have been understandable, but that "screamer" suggested that the early morning selloff was enough of a rest, and that the morning high of 55.21 had a very good chance of getting taken out to the upside. I got long again just before the breakout. I sold shortly after that, planning to jockey for position on a selloff to the low 55's, but FCX held up for the remainder of the session, which was fine.


Gain on the session: $1,050
Gain on the 23 FCX trades since March 23: $17,375

Tuesday, April 26, 2011

FCX: The 55.06 - 55.44 Gap


(Click On Charts To Enlarge, Then Click Again For Further Enlargement. Use Left Back Arrow To Return To Narrative)

From Thursday:

"GIMME A BREAK!! My 53.78 order was the EXACT low in the stock this morning, and as has often been the case lately with my trading in size (large order), the buzzard faces gave me NO shares."

When we have a disappointment like that, the important thing is to get over it as quickly as possible and to try to stay focused. Continue to FOLLOW Ms. Market, as best we can and continue to maintain our discipline. What we especially DON'T want to do is "revenge trading," in which we're angry, we're not thinking clearly and we're wanting to get even for some injustice that we feel has been done us.

As we headed for the closing gong before the holiday weekend, my order at the 53.78 low of the session that "they" didn't fill was worth about $3,000. Arrrgh... I clearly saw the possiblity that I was in danger of making "the revenge trade," so I had to slap myself upside the head a few times, and get focused. What was Ms. Market telling me about FCX?

1. FCX Bulls had found support at the 53.00 neckline at the release of earnings "Gap and Crap" low, thereby re-establishing it as support.

2. In Thursday's session, after a gap up opening, The Bears weren't able to do anything more than a near gap fill of Wednesday afternoon's 53.72 high. The session low was at my order for 53.78 (stop growling, Melf. Gr-r-r...)

3. Thursday's gap up opening not only WASN'T a "Gap and Crap" opening, as we've witnessed several times in FCX in recently weeks, but The Bulls were able to rally the stock and take out the 54.90 "Gap and Crap" high of Wednesday's release of earnings session. That isn't what The Bears expected at all. On the heels of Wednesday's "Gap and Crap" black candle session, closing near the low, and near the 53.00 neckline, The Bears expected to be able to break the 53.00 neckline, but they didn't come anywhere close to doing that in Thursday's session.

4. Near Thursday's close, FCX was holding up very well, near the high of session and it would be "parked" below the 55.06-55.44 gap, "champing at the bit" to fill it at Monday's open.

Hmmm-mm...two problems that I had with buying near the close:

1. The risk:reward was very poor. I only was wanting to play FCX for a gap fill of 55.44, which was my original plan when I entered my order Thursday morning, at 53.78, so I stood to lose more than I stood to gain taking the risk of holding over the weekend if FCX gapped down Monday morning. That definitely is a rule breaker.

2. I had very little time to decide whether or not I was "revenge trading." UGH.

I decided to have "the strength of my conviction" that The Bulls' unexpected takeout of Wednesday's 54.90 "Gap And Crap" high in the very next trading session (Thursday) was "a" tell (not THE TELL) that the gap had a VERY good chance of getting filled Monday morning. The overriding factor in making my decision was my $15,000+ war chest that I had accummulated in my 21 FCX trades since March 23 to back me up in taking the very poor risk:reward "rule breaker" trade.

If I hadn't had that war chest to back me up, I would not have taken the trade.


I paid 54.91 for FCX, which was a penny above Wednesday's 54.9027 "Gap and Crap" high, which The Bears "shouldn't" have allowed to be taken out.


Sold FCX on approach to 55.44, the top of the gap, AT THE MARKET. No fooling around with a limit order on tha-at one!

Gain on the trade: $1,275
Gain on the 22 FCX trades since March 23: $16,325

Monday, April 25, 2011

Goldcorp (GG) - Three Ascending Triangles


(Click on charts to enlarge, then click on them again for further enlargement. Use left arrow on your browser to return to narrative).

Why is it that we find really nice trades, just when the move is OVER? Curses!

GG came to my attention this weekend, and when I opened the chart, I immediately saw the larger Ascending Triangle (the first one) and could see that the target (55.56) probably already was MADE. It was. On Thursday, April 20. What I didn't see immediately, though, was that Thursday, April 20 also was a breakout of another Ascending Triangle! Oooo-oo...

As you know, I always use the more conservative of my choices to establish targets. The highs of this second Ascending Triangle are 54.72 and 54.68. The breakout occurred crossing 54.65, so...

Math:

54.68 - High of the pattern
52.15 - Low of the pattern

54.68 - 52.15 = 2.53 points of upside on the break above 54.65.

54.65 + 2.53 = Target: 57.18 IN PLAY


Four things that I especially like about this second Ascending Triangle: (1) the Gap Up already has been filled; (2) the gap fill was a successful retest of the top of the pattern (white arrow); (3) Since the breakout of the second Ascending Triangle, a THIRD Ascending Triangle has formed (pattern in red)! and, (4) Within the third Ascending Triangle, there's a little Symmetrical Triangle (pattern in orange), "nested" within it (Yes, I actually am drooling).

The ideal spot to buy the second Ascending Triangle breakout in GG was on the successful retest of the breakout (white arrow). Confirmations like that are quite nice. This still looks like a very nice opportunity, though. The highs of the third Ascending Triangle are 55.76 and 55.80. Low is 54.68, so that's about 1.10, added to a breakout above 55.80 would be a target of roughly 56.86 IN PLAY, not much below the second Ascending Triangle target of 57.18 that already is IN PLAY. I'm too busy drooling over this pretty chart and the interesting fractal behavior to calculate it exactly ;)

"Fractals" is just a fancy name for "repeating patterns." The THREE Ascending Triangles.

Sunday, April 24, 2011

An "Everyman" Question

Priapusmon,

My answer to your question went way-y-y over the 4,096 characters that the comment section allows, so I have to answer it here:

(Or in a simple way, what is causing or forcing it to fall the same distance from the breaking point?)

That question is clearer to me than your initial question. Thanks for clarifying.

I suspect that it has something to do with Newton's Third (?) Law of Thermodynamics, which states something like, "For every action, there's an equal and opposite reaction," but I'm not sure. I'm rotten in science. Got a "D" in Physics, so take that under advisement ;)

Let's say that for six months (random number), a stock trades between 20...24...20....24...20 ...24...20... 24. Trading EXACTLY between those numbers only would happen in a perfect world, but it's just an example of well-established (six months) "range-bound" trading. Trading in this example is "bounded" by a "range" of four points.

Players are buying when the stock hits 20, or near that price. Players are selling and/or selling short when the stock hits 24, or near that price, and that strategy is working out fine.

Now, let's say that one day, the stock gets back to 24 where players normally were selling and/or selling short, expecting it to selloff four points, back to the bottom of the range at 20, but this time the stock goes through 24.00, and starts trading at 24.02 ... 24.05 ... 24.09 ... 24.15 ... etc.

The stock clearly has broken out of the four point range, moving to those higher prices. How high? We don't know, but the prior four point range "suggests" that if the stock kept rallying four points from 20 to 24, and kept selling off four points from 24 back to 20, there "likely" is a similar move of four points coming, to 28, fueled by some, or all of the following:

Fundamentals:

1. Improved outlook for earnings
2. An actual release of earnings that is better than the market expected
3. Improved outlook for the sector in which the stock trades
4. Improved outlook for the economy, in general

Technicals:

1. At trades above 24, everyone who bought the stock between 20 and 24 is holding a winner. Many of them will want to add to their positions. "Double down on winners, not on losers (there's an except to the latter, but that's another discussion)."

2. Players who weren't in the stock at all want to buy the technical breakout. The four point trading range FINALLY has been resolved, and the resolution is to the upside. Players become aware of the technical breakout from various sources, for example: (1) stocks making new highs; (2) vol % increases; (3) analysts upgrade; (4) news about the underlying commodity/sector, etc.

Players get an appetite for the stock and say, "YUM! YUM! GIMME SOME!"

3. Players who always correctly sold when the stock got to 24 now stop doing that because they recognize that 24 isn't resistance for the stock any more. That not only takes selling pressure off the stock because they stop selling their shares, but many of those players will correctly abandon The Bear camp, and correctly join The Bull camp and buy the technical breakout.

4. Players who always correctly shorted the stock at 24 and who don't BUY TO COVER on the technical breakout to the upside are now Bears who will become "unwilling Bulls" as the stock moves higher, above 24. When the stock hits 25 ... 26 ... even though their sentiment might still be bearish, they begin to capitulate (surrender) and BUY TO COVER their short postion. That's more fuel for the rally.

5. Other Bears, of the stubborn, "PermaBear" variety, will short the technical breakout and also will keep shorting the stock all the way up. Those Bears also will be continually pressured to BUY TO COVER their short positions as the stock rallies, and if the stock really takes off on them and the stock goes to 40 ... 50 ... 60, Bears who stubbornly remain short the stock not only will be forced to BUY TO COVER, they might also be forced out the market entirely by losing most, or all, of their capital (Example: The 500 point rally in this morning's NASDAQ chart, after "THE TELL." Insistent Bears get hurt very badly in a move like that if they refuse to capitulate).

Much of the ensuing rally after the breakout above 24 (unless it's a false breakout) is due to "Buying Begets Buying." Bulls are buying, and Bears are BUYING TO COVER. The proverbial "everyone" is a buyer of the stock, fueling the rally. If there is a "continuation" pattern along the way that breaks out to the upside, that's more fuel for the rally. If/when the stock gets to 28, or reasonably close, players know that the last trading range was four points. They have a nice gain and some of them take profits. That certainly doesn't mean that the stock can't go MUCH higher than the 28 target, and stocks often do. The 28 target only tells us that the "measured move" of four points (the prior trading range) got MADE. Nothing else, beyond that.

All of above is just my own understanding of the basic theory behind a move, "in a perfect world." We know that technical analysis certainly isn't an exact science, which is why targets only help to point us in the right direction and are guesstimates of "what we're aiming for."

All of the above also is just my own opinion, and not technical analysis dogma by any means. If you asked your question of 20 different analysts, you'd probably get 20 different answers. I'm not very good at the mechanics of, or the exact theories behind, WHY things work.

Now, listen, Priapusmon. As much as Melf Elf loves you, a lot of the stuff that you ask me is in textbooks at your local library, bookstore, or on the internet. I don't want to short-change anyone and blow them off with with a two second answer, so your questions take a lot of time to answer, make me think too hard and hurt my brain. Your questions also seem to be based in wanting an exact reason for things, and in wanting to know when we can be sure about something, and trust it, like a technical breakout or breakdown. Believe me, we ALL can relate to wanting to know those things.

SHORT ANSWER: (Which I should have gone with in the first place): Technical analysis is an inexact science (some say that it isn't a science at all) and we never can be sure about ANYTHING unless/until we get the final confirmation that a target has been MADE, or reasonably approximated, and by then it's too late to make a play for that particular pattern target if we didn't buy the breakout or breakdown, or buy a retest of the breakout, or buy somewhere along the way.

Because of that lack of certitude in the market, which always is present, a technical breakout or breakdown is a case of "take your best shot, if you want to play it," depending on the many, many factors that we discuss. We simply aren't going to win all of our trades, and that fact needs to be accepted before playing.

Now, take it easy on Ol' Melf Elf, okay? (grin...grin)

FCX & NASDAQ: "The Tell"


(Click on charts to enlarge, then click on them again for further enlargement. Use left arrow on your browser to return to the narrative)

When I first was learning technical analysis, I remember reading experienced players talking about "THE TELL." In the context in which it was used, it meant that after a period of trying to figure out what the heck was going on in a chart, Ms. Market finally lets us in on the secret of her intentions with "THE TELL."

Ooooo.ooo...that sounded wonderful! I wanted to know as much as possible about "THE TELL."

Often, we will get "a" tell, like when a pattern breaks out or breaks down. Sometimes, the target gets MADE with no problem at all, but as we see so often, they also can "morph," or change, into something else which can get frustrating, to say the least. That's why I like "nested" patterns (patterns tucked within larger patterns) and multiple patterns. When those patterns are completed with "THE TELL" (a breakout or breakdown), they tend to be a lot more reliable, particularly in Hourly, Daily and Weekly charts.

A recent example of "THE TELL" was the April 11 technical breakdown in FCX. After a DOUBLE "Gap And Crap" breakout of a possilbe Bearish Wolfe Wave to the upside, "THE TELL" came when FCX broke the lower trendline of the pattern at 56.33, and in the same session, also broke the neckline of a H&S Top (basis the 10-Minute chart that we looked at back then) that was "nested" within the Bearish Wolfe Wave, breaking below 56.64. There never are any guarantees with these things, but the "body of evidence" from that "TELL" sure suggested that FCX had some downside in it from those breakdowns, and both the H&S Top and Bearish Wolfe Wave targets did get MADE with no problem at all. FCX went about dollar below the Wave 6 target line in the April 18 Doji Star Hammer session.

Another excellent example of "THE TELL" is the past year of trading in the NASDAQ Composite which we're going to walk through step-by-step as "THE TELL" unfolded, if anyone has the stamina to do it. It's good practice, and understanding charts takes A LOT of practice.

The comments are on the charts, for easier reading, to that you don't have to toggle back and forth. The charts also contain a good example of what I mean when I say that "The Bulls have some repair work to do," another example of which is the H&S breakdown in US Steel (X) that we looked at yesterday.

Happy Easter to everyone!


Saturday, April 23, 2011

US Steel (X): Ahead Of Earnings


(Click on charts to enlarge, then click on them again for further enlargement. Use left arrow to return to narrative).

Given the incredibly rapid advances in technology, it wouldn't surprise me if one day after I've croaked off (or even before), someone invents a technical analysis program that does all of the work for us to help us make our trading decisions. If someone does, please tell them that it was Melf Elf's idea, and have them send my share of the profits to:

MelfElf@heaven.com/roomwithaview

The program would go something like this:

Trading Buddy: Good morning, Melf Elf, you little stinker! You still are holding your shares of US Steel that you bought for 44.80 on 11-2-10 when the Falling Wedge broke out, despite the fact the it was suggested that it might be a good idea to take profits when the Symmetrical Triangle target of 56.34 got MADE on 12-15-10.

Melf Elf: Do you HAVE TO say that every morning?! Who needs a judgmental Trading Buddy, anyway? Curses!

Trading Buddy: See? You ARE a little stinker, aren't you?

Today, 4-8-11, US Steel is at the neckline of the H&S Top pattern that I have explained to you. Do you require a review of that pattern?

Melf Elf: No, Creep Face! You've been harping on it every morning for the past month. It still hasn't broken down, has it?

Trading Buddy: No, it hasn't. Would you like to SELL, or continue to HOLD.

Melf Elf: If it hasn't broken down on a CLOSING basis and you haven't suggested selling it yet, I'm not selling! Why can't you tell me if it's going to break down, or not?

Trading Buddy: I do not know the future, nor do I ever TELL YOU what to do. You must make your own decisions, based on the information that I give you.

Melf Elf: CREEP FACE!

Fast forward to the 4-18-11 close...


Trading Buddy: Good Morning, Melf Elf!

Melf Elf: Oh, you again :(

Trading Buddy: US Steel remains below the neckline of the broken H&S Top, where I suggested on 4-9-11 that it might be a good idea if you sell the CLOSE below the neckline. Would you like to SELL, or HOLD today?

Melf Elf: Well, geez, I'm not selling now-w-w. Didn't you say that it at least would return to the broken neckline?

Trading Buddy: REVIEW: After a technical breakout or breakdown, stocks often retest them, but not always.

Melf Elf: TELL ME! Is it going back to that neckline?

Trading Buddy: I cannot predict the future.

Melf Elf: I'm holding, CREEP FACE!!!

Fast forward to the 4-22-11 close...


Trading Buddy: Good morning, Melf Elf!

Melf Elf: Hey, you were right! It did return to the neckline. Nice going!

Trading Buddy: I didn't tell you that. Would you like a review of what I said?

Melf Elf: No. I know what you said. You're evil. I think you really knew that it would return to the neckline, but you just wouldn't tell me that.

Trading Buddy: I do not know the future.

Melf Elf: Yeah, yeah. Right.

Trading Buddy: REVIEW: On 4-19-11, US Steel returned to the neckline of the broken H&S Top. On 4-20-11, the stock gapped back above the neckline, but closed below by three cents: the neckline was at 52.78; the close was 52.75. On 4-22-11, US Steel closed back below the neckline...

Melf Elf: ... Was that a "Gap and Crap" above the neckline that you enjoy talking about so much because you get a chance to say "crap?"

Trading Buddy: Uh-huh.

Melf Elf: See? You're evil.

Trading Buddy: US Steel is slated to report earnings on 4-26-11. Would you like to SELL, or continue to HOLD?

Melf Elf: Tell me again what you said about earnings?

Trading Buddy: That's a "wild card." ANYTHING can happen at earnings, or at the release of any news about a stock.

Melf Elf: Like?

Trading Buddy: If the earnings are well-received by the market, US Steel could go back above the neckline, or even gap above the 57.55 high of the Right Shoulder, if they knock it out of the park with earnings.

Melf Elf: Which would mean?

Trading Buddy: A close back above the neckline would negate the bearishness of the broken H&S Top, as of that candlestick.

Melf Elf: What would that say about the future for US Steel if it can get back above the neckline?

Trading Buddy: I can't predict the future.

Melf Elf: What good are you, CREEP FACE?

---------------

A program like this would need a lot of work, but we can get the general idea of it. Just about anything we read about the stock market involves PREDICTIONS. Questions from shareholders are about wanting someone to PREDICT what's going to happen next with any given stock. Some predictions will be right. Some won't be.

This is why I always say that I try to FOLLOW the market, as best I can, and I don't even think about "being right," or "being wrong," as though either were some state of "being."

I don't have the least clue what will happen with US Steel when earnings are released. Like "Trading Buddy," I can't predict the future. What I can do, though, is look at this chart heading into earnings, and if I were a shareholder (I have no position in US Steel), make the best money management decision that I can.

Personally, based on how badly positioned US Steel is heading into earnings, I'd have to TAKE THE MONEY and sell it. That isn't advice, or a recommendation. I don't advise or make recommendations.

Thursday, April 21, 2011

FCX: Melf Elf Single-Handedly Supports The Stock


(Click on charts to enlarge them, then click on them again for further enlargement. Use left arrow on your browser to return to the narrative).

When I saw that FCX was indicated at BID: 53.73...ASK: 53.75 in pre-market, it became obvious to me that I got shaken out yesterday afternoon when FCX swooned into the close. I don't mind paying up for a stock, once I can see what's going on. I placed my order for 2,500 shares of FCX at 53.75 in pre-market, an hour before the open. There were plenty of trades below my order, in the 53.60's, but I got NO shares filled by the 9:15 close of pre-market trading, so I yanked my order and raised it to 53.78, above yesterday afternoon's 53.72 high, figuring that I'd get my shares executed on a gap fill.


GIMME A BREAK!! My 53.78 order was the EXACT low in the stock this morning, and as has often been the case lately with my trading in size (large order), the buzzard faces gave me NO shares. C'mon, 500 shares isn't tha-at large of an order on a stock that has traded 9,000,000 shares in the first half of today's trading.

It's just a wee bit annoying to "get it right," but not make any money on it. I refuse to allow that to annoy me, though, and will continue to have a very positive attitude about the stock market.

Dirty rotten Buzzard Faces. Curses!

Gain on the session: Zeeeeeeeeeeeeeeeeeeero.

FCX: The Market's Response To Earnings


(Click on charts to enlarge, then click on them again for further enlargement. Use left arrow on your browser to return to narrative)

Pre-earnings comment, from April 16:

"Needless to say, The Bulls are very badly positioned heading into earnings. Players who bought FCX for the long-term obviously won't sell into rallies, but many short-term players will. If FCX blows out earnings and beats everyone's expectations, no matter how big the stock gaps up ... to the 53.00 neckline ... to the 55.00 gap ... it will be a gap up directly into a one month overhang of supply (willing sellers, who would like to get out of the stock with a break even, smaller loss, or a small gain)."

After earnings were reported, the high two minutes into trading was 54.90; the session low was 53.05, right at those two key levels that we looked at on April 16, before the release of earnings.

Why wasn't there a better response to the good earnings?

ANSWER: "...it will be a gap up directly into a one month overhang of supply (willing sellers, who would like to get out of the stock with a break even, smaller loss, or a small gain)."

That kind of response has nothing whatsoever to do with things like earnings per share, revenues, margins, cash flow, dividend increases, etc. Longs who were trapped above the 55.06 gap down from April 11, and the three-months worth of longs who have been trapped at higher prices since last winter (the "overhang of sellers" that we've discussed), who failed to take the opportunity to sell on the last rally to 58.75 simply wanted out, irrespective of how good the earnings were. Those players simply want their money back, and many of them sold. Yesterday's "Gap and Crap" selloff is an excellent example of "working off the overhead supply of sellers."

FCX was so badly positioned, technically, at the release of earnings that I would have "sold into strength" on the opening rally I if had a long position (I posted a comment in that regard on the Yahoo FCX Message Board near the open). A giant gap like that into resistance is marked for a strong likelihood of a "Gap And Crap" session. Stocks usually aren't initially successful when they try to bully their way through mulitple levels of resistance, no matter how good the earnings are. The rally usually gets "called back" for some backing and filling of the gap.

In this particularly case, The Bulls got "called back" for Bullying near the 55.00 yardline, and were penalized back to the 53.00 yardline. LOL.

I liked the pullback to the neckline, near 53.00, so I took a position of 500 shares, at 53.09. One of the most bullish things that FCX can do here is NOT fill the gap below the neckline, then move steadily higher. That would re-establish the neckline as support and would be a very strong show of strength. A gap fill seems more likely, but gaps don't "have to" get filled.

No better example of that than the gap up from FCX's July, 2010 release of earnings, which also was a gap higher on better than expected earnings, and which also was a "Gap And Crap" session. Comments are on the chart.


Getting back to yesterday's action, intraday, basis this 5-Minute chart, FCX looked good coming off the neckline retest (the 53.05 low on the session): FCX:

(1) broke out of the Falling Wedge (pattern in white)

(2) successfully retested that breakout (white arrow)

(3) formed and broke out of a little Bull Flag (pattern in orange)

(4) successfully retested the Bull Flag breakout (orange arrow)

(5) moved higher and took out nearby resistance, at 53.65 - 53.67

Very nice!

But, then...

FCX swooned into the close, taking out the 53.32 successful retest of the Bull Flag (UGH), then threatened to take out the 53.20 low of the Bull Flag, which it did in very short order. UGGGH.

I threw in my 500 shares, at 53.24. When Ms. Market tells me that something IS a technical breakout (there were two), and that something IS support (we had two successful retests of the pattern breakouts at the arrows), then Ms. Market turns around and tells me that it ISN'T support any more (the Bull Flag retest low got broken...the bottom of the Bull Flag got broken), I get outta there, regardless of what happens after that. I simply didn't like my position at that point and had my doubts about The Bulls' ability to hold the neckline in this 53.00 area, with no further retest of the gap below it. I hope that they can, but when I have serious enough doubts, which I did, Ye Old Market Market maxim comes to mind:

"When in doubt...get out!" I did. I always can get back in it again.

Overall, despite the black candle in the daily chart, the market's reaction to earnings helped The Bulls to get out of the hole into which they dug themselves on the smackdown from 58.75 to 49.71. Even if the earnings gap gets filled entirely, The Bulls can do some repair work here and move FCX higher.


Gain on the session: $50 (Thank you, Ms. Market, even though it was paltry)
Gain on the 21 FCX trades since March 23: $15,050

Wednesday, April 20, 2011

CRUS: What The Heck Happened?


(Click on chart to enlarge, then click on it again for further enlargement. Use left arrow to return to the narrative).

Sadly, when market participants ask that question, it usually is only a rhetorical question. They generally aren't wanting to know the particulars of what actually did happen, nor are they wanting to learn anything so that they can avoid making the same mistake again. What they really are asking is, "Am I going to get my money back? When? Will somebody please just TELL me that?" They want palliatives like, "Don't worry. This stock is going MUCH higher!"

Charts don't always give us a clear picture of what is happening. Sometimes charts are erratic, with up and down moves that are very difficult to understand, in which case I think that they are best avoided. Others, like CRUS, do give us a clearer picture of what is happening.

RISING WEDGE:

On March 7, CRUS broke down below the lower trendline of a Bearish Rising Wedge, at 23.81, putting a downside target of 19.83 IN PLAY. That breakdown also set up the potential for a Double Top, with the highs at 25.48 and 25.18. The pivot for the Double Top, or "M"-Top (it looks like the letter "M") was the February 23 low of 21.17.

DOUBLE TOP:

The Double Top got put in on March 10, when the 21.17 pivot got taken down. That put a downside target of 17.16 IN PLAY.

Math For The Double Top:

25.18 - High (I always use the more conservative of the two tops (25.48 & 25.18)
21.17 - Low of the Double Top pattern

25.18 - 21.17 = 4.01 points of downside on a break below 21.17

21.17 - 4.01 = Target: 17.16 IN PLAY

After the Double Top was put in, CRUS managed a one day rally back above 21.17, known as a "One Day Wonder," but that failed and the Rising Wedge target of 19.83 got MADE on March 18 at the bottom (Green #3) of what later became a Falling Wedge.

FALLING WEDGE:

As I've said many times, Falling Wedge breakouts are my least favorite bullish pattern because there is immediate price resistance within, and all the way to the top of, the Falling Wedge, and depending where the Falling Wedge occurs in the chart, there often is additional nearby overhead resistance, as was the case on the Falling Wedge Breakout in CRUS.

CRUS broke out of the Rising Wedge on March 24 and even successfully retested the top of the Wedge intraday, but it was heading straight into IMMEDIATE resistance from the Double Top: 21.17 on up to 25.48. There was an "overhang of sellers" who were trapped in the Double Top, and who wanted out of the stock on any rally above 21.17.

ROLL OVER AND DIE:

I don't think there's a technical term for when a stock breaks out to the upside, then rolls over and takes out the low of the pattern (19.51 in this case, at Green #3) then continues down...down...down, so I've dubbed it the "Roll Over And Die."

On the technical upside breakout of the Falling Wedge, some players will use "the last low" before the breakout as their stop, which was 19.82. Others will use the low of the pattern, 19.51, as their stop. That's an individual choice and either stop is perfectly fine, as long as we do use a stop loss!

BLIND-SIDED:

When CRUS came out with bad news regarding margins on April 15, shareholders got taken by surprise. From both a fundamental and technical standpoint, there simply is no way to predict these "out of the blue" events and it's terribly disappointing if we're long when news like that comes out.

But, anyone FOLLOWING the technical breakdowns had plenty of advance warning prior to the April 15 gap down to 16.94 that the stock had problems and they had a number of opportunites to get out of the stock and buy it back at much cheaper prices if they really liked the fundamentals:

23.84 - Rising Wedge breakdown on March 7
21.17 - Double Top breakdown on March 10
19.51 - the second takeout of, and CLOSE below the Falling Wedge, on April 8

SHAMELESS PUMPING (My subjective opinion)

When CRUS tanked to a low of 15.63 on April 15, at least two analysts that I know of got behind the stock and pumped it and table-pounded so hard, I think they left a few pompoms on the floor before they left for the day. Sheesh...

They pumped the stock so hard, CRUS finished the session on a VERY bullish-looking hammer. If all of that pumping had produced a Gap Up in the next session, we would have been looking at Bullish Island Reversal possibilites, ala the November 22, 2009VERY Bullish Island Reversal out of a Symmetrical Triangle pattern (the blue pattern at the lower left of the chart).

As we can see, though, the pumping only had a short-term effect. CRUS took out the 15.63 low of the bullish-looking hammer in the next session. Yesterday, CRUS put in another bullish-looking Doji Star Hammer, finishing out the session at 15.63. That candlestick "could" produce a rally, but CRUS now has four months worth of nearby overhead resistance and some repair work to do.

Summary: That's "what the heck happened," to date ;)

Tuesday, April 19, 2011

SLW: Nested Falling Wedge Breakout


(Click on charts to enlarge, then click on them again for further enlargement. Click on back arrow to return to the narrative).

Despite the two bearish pattern breakdowns that we looked at this morning (Rising Wedge; Bear Flag), when the larger trend is bullish, as it still is with SLW, we want to continue to look for signs of bullishness. Yesterday's candlestick was a Bullish Hammer in the daily chart, but we want confirmation of that and often the very short-term charts can help us with that.


After the opening gambit to 42.20, SLW settled into this Falling Wedge pattern (in white), which contained a "nested" Head & Shoulders Top. H&S patterns normally are seen at tops and bottoms, but not always. This one was in the middle of the pattern.

Because of the short-term bearishness that we've witnessed in SLW, I was suspicious of the Falling Wedge breakout, but I like "nested" patterns a lot. When SLW broke out of the Falling Wedge for the second time and was moving higher, I put in a limit order to buy 2,500 shares at 41.41. They only filled 200 shares, then took SLW higher, and took out the 41.53 high of the Right Shoulder of the H&S Top. UGH.

I don't like to "pay up" for a stock for no reason, but that Right Shoulder takeout at 41.53 was bullish, as we saw awhile back in the Hourly chart of FCX. I "paid up" for SLW, at 41.53, on that Right Shoulder upside takeout. Mental stop: below the double lows at 41.19 and 41.19.

My initial target was 41.86, which was Data Point #3 of the Falling Wedge and I sold all of my shares on the rally to that level. The risk in selling there is that we aren't given the opportunity to get back in on a pullback, but that's fine. We won't turn our noses up at a gain ;)

I was able to buy back my shares on a retest of that Right Shoulder high of 41.53, I repurchased SLW for 41.58. After the pullback to 41.33, the next target was a rally "toward" the top of the Falling Wedge, at 42.20. Stocks don't always return to the tops and bottoms of wedges, and have to be monitored along the way.


Buying "in size" (a large number of shares) can be a problem, as it was for me again with this trade, only getting filled on 200 shares of my 2,500 order, but that's the breaks and we won't allow ourselves to become annoyed.

The lousy dastards! Curses!


By the time SLW got back to the top of the Falling Wedge, the chart looked so nice, I didn't want to sell it (greed always sets in at these times, doesn't it?), but I "took profits when the target got MADE," like a good little elf ;0


Gain on the two trades: $2,250

SLW: Counterintuitive Moves


This is the chart of Silver Wheaton (SLW) that we looked at after the April 8 close when we suspected (question marks) that we might be looking at a DOUBLE upside "Fakeout Breakout" of a nested Symmetrical Triangle (seen in the next chart), and a possible morph into a broken Rising Wedge.

Question: When a pattern breaks out or breaks down, how can we know for sure if it's for real, or if it's a fakeout?

Answer: We never can KNOW anything about the stock market beyond the last candlestick that we can see on the chart. What we can do, though, is prepare ourselves to FOLLOW what Ms. Market is telling us as the chart evolves, as best we can.

In this particular case, we prepared by identifying where Trendline #1-#3 would come in during the next trading session, Monday, April 11, and where that trendline would come in during the sessions that followed. If that trendline got violated by very much, especially on a closing basis, we would KNOW that we were looking at a morph from the nested Bullish Symmetrical Triangle breakout into a broken Bearish Rising Wedge, not because we predicted anything about the future, but because we were FOLLOWING the chart and we actually could see where a technical breakdown would occur, if it did.


The nested Symmetrical Triangle is in blue, with the little Symmetrical Triangle (in purple) "nested" within it. That "nested" pattern broke out to the upside on April 6. It was a "Gap And Crap" candlestick, but it held the breakout on a closing basis. April 7, SLW closed back inside the pattern, which always is a red flag "to be a little suspicious" of the breakout. The fact that SLW also broke out beyond two-thirds of the way to the apex of the Symmetrical Triangle was another reason that we were a little suspicious of the breakout. As we discussed when we looked at the first chart above, the failure rate in stocks that have late breakouts is higher than those that breakout prior to the two-thirds marker. I forget who did the study on that (Thomas Bulkowski, maybe?)

April 8, SLW broke out to the upside again, and everything looked fine (which is where we were in the first chart above). At that point, given how bullish this stock has been and given that it was able to break out again, it was a bit counterintuitive (contrary to what we 'think' will happen) to think that SLW would morph into the broken Rising Wedge in the very next trading session, but that's exactly what it did.

SLW came down on a Bearish Engulfing candlestick that also was a 4-Close Reversal (closed below the prior four days' closes), took out the rising Trendline #1-#3 at 44.44 and closed the session at 44.11.

Did we KNOW that was going to happen? Certainly not. Well, maybe one of you did, but I certainly didn't. All that I am capable of doing is trying to FOLLOW Ms. Market, as best I can. If I had to earn my living trying to predict anything, I'd be bankrupt. I'm terrible at it.


The second counterintuitive move (a move that is contrary to what we intuitively would expect) was the Scotia upgrade of SLW on the morning of April 15. Although it was an intermediate-to-longer-term call on the stock, upgrades often give a stock a short-term pop to the upside, so one would expect at least a pop to the upside, especially given the fact that the upgrade was a pretty significant one: from $47 to $58.

However, at Friday's upgrade by Scotia, SLW was sitting at Data Point #4, at the top of a possible Bear Flag, better seen in this intraday chart than the daily chart. And, we knew that the short-term trend in SLW had turned bearish at the Rising Wedge breakdown, at 44.44, on April 11.

Counterintuitively, SLW got no pop to the upside out of the upgrade, as one would expect, but rather, SLW sold off from the top of the Bear Flag right at the upgrade (White Data Point #4), and continued down in Friday's session. Yesterday morning, the Bear Flag broke to the downside. The target of 40.32 got MADE and the March 18 gap at 39.91 got filled with four cents. The session low was 39.95.

Interesting juxtaposition of the bullish upgrade and the bearish technicals: Short-term, the bullish call got trumped by the bearish technicals.

Market Lesson: Play what we see IS HAPPENING, not what we think should happen."

Math for the Bear Flag:

43.85 - High of the pattern
41.72 - Low of the pattern

43.85 - 41.72 = 2.13 points of downside on a break of the Bear Flag, below 42.45.

42.45 - 2.13 = Target: 40.32 IN PLAY

Monday, April 18, 2011

DRYS - Bull vs. Bear Struggle


(Click on charts to enlarge, then click on them again for further enlargement. Use back arrow on your browser to return to the narrative).

Some observations on DRYS regarding the 2007-2008 time-frame:

1. There's an old saw in Wall Street: "They don't ring bells at tops and bottoms." They're very, very difficult to catch and we usually don't recognize them until well after the fact. One of the things that we can do is to look for a "sea change," or change in character of trading. At the Bear Flag top in 2007, trading became very erratic, with wild swings to the upside and downside. That was something different, as was the technical breakdown of The Bear Flag. Prior to that breakdown, it was all bullish during the Parabolic Rally.

2. We know from many past examples that Parabolic Rallies usually end with a Parabolic return: a huge retracement to the gain, a complete retracement of the gain, or in the case of DRYS, a retracement that goes well below the origin of the Parabolic Rally, which was in the $9 area. Two and half years after the crash, DRYS stands at 4.73 and would need to rally 100% just to get back to the origin of the Parabolic Rally, which gives us an idea of how brutal Parabolics Returns can be.

3. DRYS also is a stellar example of how devastating "Doubling Down" and "Tripling Down" can be to a portfolio. There always is a rationale for doing it, like "This stock is grossly oversold," or at the November, 2008 earnings miss, "See? The stock is rallying, despite the earnings miss! That proves that all of the bad news already is factored into the stock! I'm loading up on DRYS!" The stock plummeted 87% from the release of earnings in November, 2008.

Market lesson: While we might have some success at doubling or tripling down on a losing position, it's a shame to see that strategy get rewarded because if we routinely employ that strategy, eventually, our portfolio will be loaded to the gills with stocks in which the doubling/tripling down strategy wasn't successful. And, it doesn't take very long for that to happen if we keep doubling down on losers.

Market lesson: In a Bear Market, there often are huge percentage losses at the end of the move, just when we think that "the worst is over," and that it's safe to get back into the water, as was the case with DRYS in the move down from November, 2008 earnings, and also in the move down from the Rising Channel breakdown in early 2009. DRYS fell from 13 to 2.72 on that channel breakdown.

4. At the November, 2008 earnings release, DRYS was trading at a Price/Earnings ratio of roughly 1.3 (less than 2) times Trailing Twelve Month Earnings. The rationale for buying was, "This stock is unbelievably cheap! A P/E ratio of less than 2? You have to be joking. Something is very wrong here. I'm loading up on this stock. ANYTHING is worth buying at a ridiculous P/E ratio of less than 2!"

Market lesson: If you come across a stock that is trading at a P/E of 2, or 3, or 4 and it seems totally unwarranted and the stock looks unbelievably cheap to you, run for the hills! LOL. There usually is a very good reason for that "ridiculously" low P/E, but we're not going to find out the reason until later. The market is said to be a discounting mechanism that discounts news roughly six months into the future. In July, 2009, DRYS reported earnings of $0.21, down 94% from the November, 2008 earnings of 3.53.

Oh-h-h-h...now-w you tell me!

5. At today's price of 4.73, just about all of the trading in this chart represents a huge overhang of sellers who have been trapped in the stock for nigh on three years, so we need to be mindful of that. "The farther away resistance is, the less resistance it becomes," meaning that as we move forward in time, a lot of that selling pressure gets worked off. At each year-end, for example, some players who feel hopelessly trapped at much higher prices finally capitulate and do some "tax loss selling," offsetting the loss in DRYS with a gain in another stock. That selling helps to "work off" the overhang of sellers in DRYS.

Which gets us to the near-term overhang of sellers in DRYS...


Currently we've got a Bull vs. Bear struggle in the $5+ area.

ASCENDING TRIANGLE:

DRYS broke out of an Ascending Triangle on November 9, 2010. November 17 was an earnings beat, but the candlestick was a very ominous looking Gravestone Doji, and the gap down the next session turned it into a Bearish Island Reversal: Gap up from the prior session; gap down following it.

We certainly can't blame anyone for taking profits in that situation, but after selling off and holding well above the Ascending Triangle breakout, DRYS came on strong and the 6.06 Ascending Triangle target got MADE, and was exceeded at the 6.44 high. Score one for The Bulls!

"Take profits, or at least 'some' profits when targets get MADE."

HEAD & SHOULDERS TOP:

On January 19, 2011, DRYS broke down from a H&S Top, putting a target of 3.92 IN PLAY, and that target still is IN PLAY.

FALLING CHANNEL:

Rather than just "giving it up" and letting The Bears have their H&S Top target of 3.92, The Bulls have hunkered down and have been working on a Falling Channel that, at the moment, contains a "nested" Symmetrical Triangle, with Green Data Point #4 "appearing" to have been put in last Thursday, April 14. We'll see. As we know, these things frequently "morph," so we might have to "move the chains" if DRYS takes out Thursday's low and "morphs" the pattern into a Bull Flag.

"The Tell" would be an upside takeout of 5.10 and 5.12, which would be a technical breakout of the top of The Channel, which also is a validated trendline. If that were to occur, though, we would need to curb our enthusiasm a little since the Head & Shoulders Top represents an immediate overhang of resistance, similar to what we recently witnessed with the winter overhang of sellers in FCX.

Sunday, April 17, 2011

Anthropomorphizing Technical Analysis/Indicators


(Click on charts to enlarge, then click on them again for further enlargement. Use back arrow to return to narrative).

As technical analysts, when looking for signs that a top of bottom is in (we'll look at signs of a bottom today), we look at some technical indicators for things like (1) positive divergences; (2) indicators crossing above a signal line; and (3) indicators crossing above a zero line. We'll also look at things that measure "overbought" and "oversold."

It's up to the individual technical analyst to decide if/when a signal is buy or sell, and whether he or she wants to act on it. During my many years of analyzing charts and indicators, I've created "what if" scenarios, like this one, to try to determine what happens "if" I acted on various buy and sell signals from various indicators.

In the case at hand (the MACD chart above), we're going to buy this stock based on the facts that: (1) the MACD has shown us a positive divergence, and (2) the MACD has followed through on the postive divergence by crossing above its signal line. For our purposes here, we'll conclude that the MACD is telling us to buy this stock, so let's go ahead with the purchase and see how much money we can make ;)


This looks very nice. "So far...so good."


"This is a 'head scratcher. Don't you hate when this happens? It sure looked like the MACD told us to buy that positive divergence and the bullish cross above the signal line, but what the heck does this cross below the signal line mean? It's probably just consolidating, before another move higher above the zero line, but we'd better look at the price chart. It probably is a good time to consider taking at least 'some' profits."


"WHAT????? We're down 85% on this trade?? I can't believe this! That stupid MACD told us to BUY this stock! I hate technical analysis. It DOESN'T work!"


"Well, okay, maybe technical analysis does work after all. MACD really was just consolidating, and now it has moved up through the zero line. There's no question about it ... MACD definitely is tell us to BUY this stock. It's ready to make a big move to the upside. Anyone with half a brain knows that MACD moving up through its zero line is a stone cold BUY signal. Let's buy DRYS at 12.48 and get our money back. Yeah!"


"Somebody please kill me! DRYS is back to the 3.04 low after the MACD told us to BUY this stupid stock? See? I was right all along. Technical analysis DOESN'T work!"

As tongue-in-cheek as all of that is, over the years I have read comments like that about technical indicators and about technical analysis over and over and over...

One of my favorites is "Technical Analysis SAYS this is a BUY," as though every technical analyst interprets the chart and indicators in exactly the same way.

Sigh...

The problem isn't with technical indicators, or with technical analysis. The problem is that in this example, which is one of MANY similar examples, we're anthropomorphizing technical indicators and technical analysis, that is to say, we're attributing human qualities to them, like TELLING US to buy, that can't possiblity exist. Indicators only can "indicate." They aren't human, so they can't TELL US to do anything.

I intentionally only showed the MACD indicator without the price chart because, far more often than not, when we read things like, "My indicator says BUY," or "My system says BUY," there isn't any reference at all to what the chart is doing, which is of paramount importance. A technical indicator can't possibly know what the chart looks like when it's "telling us" to BUY, and if the technical analyst takes that BUY signal out of hand without looking at the chart, which only HUMANS can do, it could spell trouble, like we've seen here with DRYS.

When any indicator "tells us" to buy or sell, we need to view that as an invitation ONLY, not as an order from some inanimate object, "telling us" to do something. The signal needs to be viewed in the context of what the price chart is doing. If an indicator "tells us" to buy, but the price chart is heading directly into overhead resistance, we might want to ignore the signal, or at least temper our upside expectations.


So that I'm not picking on the MACD (LOL), which is just one of many, many indicators, we'll have a quick peep at the RSI chart during this time-frame. Again, individual technical analysts will interpret indicators in different ways, but like most technical indicators during this time-frame, the RSI going down to a reading of 15 in October, 2008, then rising above 20, or 25 (considered a BUY signal among many technical analysts) wasn't a very good reason to buy DRYS. The stock lost about 80%of it's value after the RSI went up through the readings 20, 25, and 30 (whatever Buy "trigger" we want to use).

My own conclusion, as just one of MANY technical analysts, who might have a different view on this:

PRICE RULES!

When we get buy or sell signals, look at the chart! Buy signals from indicators when the price chart is bearish are highly suspect, if not downright dangerous, and conversely, sell signals from indicators in stocks that are bullish also are suspect, if not downright deadly, because we can got caught in horrible, relentless short squeeze in which our risk is unlimited if we get stubborn and refuse to cover our short position. For example, ask those who shorted AAPL in recent years and didn't cover because it was it was soo-o "overbought." UGH.