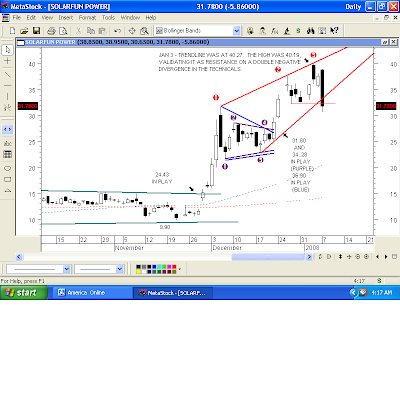

(Click On Charts To Enlarge)
I posted the first chart on January 7 when SOLF broke down from a Bearish Rising Wedge after after a 300% parabolic rally in just over one month's time. Parabolic rallies often result in a Parabolic Return to the origin of the rally as SOLF did, seen in the second chart. After the Parabolic Return, SOLF put in an Ascending Triangle. More often than not, those are bullish, but there's no "always" in the stock market. This one was a bearish continuation pattern that resolved to the downside.
Based on the current BID...ASK, the November, 2007 gap target of 11.98 will get MADE at the open. SOLF now is down 70% from its January 3, 2008 high. The Ascending Triangle target of 10.99 still is IN PLAY, but "take at least 'some' profits when targets get MADE (11.98)."


