Thursday, July 24, 2008
LEH - Bullish Wolfe Wave
(Click On Charts To Enlarge)
We looked at Chart #1 back on July 14. In Chart #2, we can see that the low came in the following day, at 12.02, on a Bullish Doji Star Hammer. Those are only bullish if the high of that candle, 14.58, gets taken out to the upside and we also want to see it taken out on a closing basis. There still is no guarantee that a significant low is in. If it isn't in, stop it out below the 12.02 low.
In this case though, LEH put in a very strong candle on July 16, taking out the 14.58 high of the Bullish Doji Star Hammer, and closing at 16.65. From there, it regained the Wolfe Wave, failed the first attempt to break out above the Wolfe Wave, found support at the bottom of the Wolfe Wave, then broke out of it on a closing basis in yesterday's trading.
So far, so good. If LEH doesn't get to the target line (#6), this still is one heck of a nice rally, consistent with Wolfe Waves. At yesterday's high, LEH was up 83% in only seven sessions, gaining almost as much as it lost in one and a half years!
Tuesday, July 22, 2008
UYG: H&S Top Update
(Click On Charts To Enlarge)
From this morning:
"...the neckline breaks puts a downside target of roughly 18.76 IN PLAY."
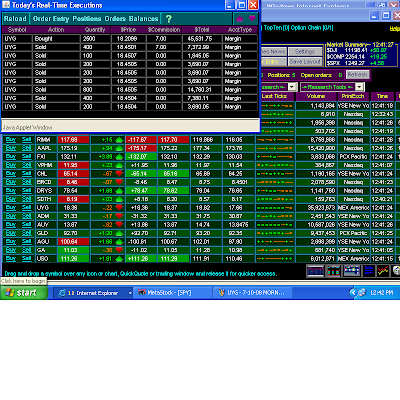
This came down so fast this morning, I covered my short from 20.96 at the top of the Bear Flag yesterday afternoon, at 19.15 for a little over a $4,500.00 gain. The UYG continued down from my exit and got to 18.96, within twenty cents of the 18.76 target. It's had a good bounce from there, currently at 19.89 (I posted the trade for credibility purposes since the UYG has had a HUGE bounce, currently at 20.04!!)
UYG: H&S Top Possibility
(Click On Chart To Enlarge)
From yesterday afternoon:
"The target line (#6), if the pattern completes, is down around $20."
The Wolfe Wave target near $20 MADE in after hours on AXP's earnings disappointment.
Sometimes Bearish Rising Wedges/Bearish Wolfe Waves "morph," or change, into a Bearish H&S Top. If that's the case here, the Wave #5 upside fakeout/breakout becomes the "Head" of the pattern, and the neckline is 20.15 and 20.21.
Measuring the height of the pattern from where the neckline was when the Head was put in, then subtracting that amount from where the neckline breaks puts a downside target of roughly 18.76 IN PLAY. A .382 fibonacci retracement of the rally from 14.08 to 21.63 is 18.75, right at the target.
19.52-19.54 is horizontal support which I would expect to get tested, at a minimum.
Monday, July 21, 2008
UYG: Bearish Wolfe Wave
(Click On Chart To Enlarge)
Short-term (10-Minute Chart), the UYG broke below a Bearish Wolfe Wave at 11:30 this morning. Since then, it's been stalled in a Bear Flag rally (pattern in yellow), chasing the bottom of the broken Wolfe Wave. The target line (#6), if the pattern completes, is down around $20. The pattern is negated if the UYG closes back above the top of the pattern, and above this morning's 21.63 high.
Sunday, July 20, 2008
VPHM and LEH: Wolfe Waves In Review
(Click On Charts To Enlarge)
Charts #1 is last weekend's "possible" Bearish Wolfe Wave. Chart #2 is the DOUBLE negative divergence that we had last weekend in the MACD. We're all taught early on in the stock market to follow the technicals and fundamentals, but we often forget to do that. With respect to the fundamentals, it is most important to follow the REACTION to them, and we had a good example of that this week.
Chart #3 is the price action in VPHM to date. We can see that Monday was a rally that got to within 3% of the 13.21 target that was IN PLAY from the June 4 breakout of a 10-month Ascending Triangle.
Tuesday there was news on the stock. What was the REACTION to the news? That is what is important. The REACTION was a gap down in the stock, a move down back inside the Bearish Wolfe, and a severe tank on the heaviest volume since The Crash of August, 2007.
There was a snapback rally on Tuesday, and a bit more rally on Wednesday, back inside the broken Bearish Wolfe Wave, that got VPHM to the Tenkan-sen and Kijun-sen (equivalent to an 8-day and 21-day MA) at 11.28 and 11.29, and that was all VPHM had on the upside. Wednesday's high was 11.26 just below that RESISTANCE.
Longs who didn't get out on the first plunge to 9.67 on Tuesday "sold into strength" on the snapback rally, and any rally back to RESISTANCE always is an invitation to the shorts.
"Sell and/or sell short rallies back to broken support, which 'should become' resistance." It did. VPHM sold off from 11.26, then tanked again on Thursday and Friday. UGH.
It's difficult to get our opinions about the fundamentals out of our way, I know, but I find it best to try to combine them with what the market's REACTION to the fundamentals is, and that gets played out in the chart as we can see from the breakdown, just as we could see the bullish UPSIDE breakouts in VPHM at 9.05, 9.25 and 10.07 when we discussed them back in June.
Despite the prevailing bearish opinions of LEH's fundamentals, for example, we could see from the chart last weekend the possiblilty of a Bullish Wolfe Wave. The short side of the LEH trade was EXTREMELY crowded. LEH (Chart #4) rallied a sizzling 68% from its 12.02 low this week, to its high of 20.15. Regardless of how the Bullish Wolfe Wave possibility plays out in the days to come, that was one heck of a nice rally in LEH this week!
Thursday, July 17, 2008
LEH: Don't Ignore The Technicals
(Click On Chart To Enlarge)
From this morning...
"...this 68% rally in just two days is exactly the type of sharp reversal that is a hallmark of a good Wolfe Wave. When you get this kind of awesome rally, take profits, or at least some profits."
You're never going to go wrong taking a profit, especially a big one like this, and especially when the rally has reached an area of resistance.
We can see from the Hourly Chart that LEH rallied directly to trendlines off the Symmetrical Triangle that broke down on July 9. The 68% rally, to 20.15 this morning, turned out to be the exact short-term high.
"Former support 'should be' resistance on a rally." It was. ALL of the price area of that broken Symmetrical Triangle represents resistance on a rally, known as "congestion," so that's a good place to take profits.
From there, LEH sold off $3.30 to fill the 16.85 gap from yesterday. The low was 16.81. That's a nice re-retry long. We're playing with House Money at that point. Just make sure to limit losses and not give back too much of the gain on any further selloff.
In this case, though, from the 16.81 gap-filling low, LEH has rallied another 11%, to 18.66, so far. It's at BID 18.50...ASK 18.51.
LEH: Up 68% In 2 Days
(Click On Chart To Enlarge)
It's a moot point whether or not this is a bullish Wolfe Wave. As I said three days ago, LEH is very overcrowded on the short side and this 68% rally in just two days is exactly the type of sharp reversal that is a hallmark of a good Wolfe Wave. When you get this kind of awesome rally, take profits, or at least some profits.
Wednesday, July 16, 2008
SKF: The Bullish Wolfe Wave
Tuesday, July 15, 2008
VPHM: No "Capitol" At Risk...LOL.
(Click On Chart To Enlarge)
"This "Melf elf" guy is just on the wrong side of the trade with no capitol at risk, trying to drum up business."
I received that message today on the UYG Message Board. LOL. I shorted VPHM yesterday at 12.10, on what I thought was a Wolfe Wave 5 upside fakeout. It was.
If I had known that I would get this pitiful challenge, I would have printed the entry, but I've printed the "Buy To Cover" from this morning between 10.65-10.69 ahead of the Wolfe Wave target since VPHM had such a huge drop at the open. Gain: $3,500.00+
Why do I bother? Anybody see me trying to "drum up business?" Sigh...
VPHM: Bearish Wolfe Wave Target MADE
(Click On Charts To Enlarge)
From yesterday:
"The basic idea behind a Wolfe Wave is that the market is stretched in one direction to the point that Wave 5 turns out to be a fakeout, and the market reverses and heads for the Target Line (#6), usually in a sharp, snapback fashion.
VPHM is a "possible" Bearish Wolfe Wave."
This morning's downside reversal was very sharp, with VPHM down over 20%. The Bearish Wolfe Wave target MADE at 10.39, and was exceeded on the downside.
Monday, July 14, 2008
VPHM And LEH: Possible Wolfe Waves
(Click On Charts To Enlarge)
The basic idea behind a Wolfe Wave is that the market is stretched in one direction to the point that Wave 5 turns out to be a fakeout, and the market reverses and heads for the Target Line (#6), usually in a sharp, snapback fashion.
VPHM is a "possible" Bearish Wolfe Wave. Friday was a Long-Legged Bearish Doji Star Hangman sitting above the pattern and suggesting a possible reversal to the downside. There's also a DOUBLE negative divergence in the MACD (Chart #2).
LEH is a "possible' Bullish Wolfe Wave sitting below the pattern and suggesting a possible upside reversal.
Friday, July 11, 2008
LEH: Sold
LEH: Bull Flag Breakout
(Click On Charts To Enlarge)
I bought LEH at $14.50 at 2:48PM ahead of the Bull Flag breakout, one minute before it took off like a rocket on the good news about FRE and FNM. Whew! I had planned just to trade it, but if it closes near $15, I'm going to hang onto it into the close. The trade is crowded on the short side. CNBC mentioned today that put buying in LEH is very heavy. We'll see.
USO: Rectangle Target MADE
(Click On Chart To Enlarge)
Tops and Bottoms are very difficult to call in stocks/indices that are in a strong trend. USO broke out of a Rectangle on June 26, which put 119.17 IN PLAY. The initial rally got only to 117.46 on July 3, then USO went back below the breakout, and back toward the bottom of the channel. This morning, USO ripped to the upside at the open, disappointing the shorts, and the 119.17 target got MADE in the first minute of trading.
UYG: The Rectangle
(Click On Charts To Enlarge)
I tried the long side of UYG yesterday morning, but when the fourth pattern broke to the downside at 18.46, I took another gain of just under $600.00 and called it a day. Between 1:30 and 3:00PM, the UYG tested both extremes of the day, and neither Bulls nor Bears won the day. Basis the 10-Minute chart (#3 above), we're left with a Rectangle: Highs of 18.82 and 18.81...lows of 17.66 and 17.68, so we add or subtract the height of the pattern to or from whichever way the pattern breaks out. I always use the more conservative of the two numbers, so...
18.81 - 17.68 = 1.13 points, so 19.94 would be IN PLAY on an upside breakout; 16.55 would be IN PLAY on a breakdown. Futures are down hard at the moment, but we'll see.
In the daily chart, we've got a Bullish Doji Star Hammer. It's only bullish with upside follow-thru. Wednesday's candle was black, so if the UYG can break out above the Rectangle and CLOSE at 19.60, or better, the 3-day pattern, including today, would be a Bullish Morning Star.
The MACD is very supportive of a rally. There are TWO bullish divergences in the histogram (vertical black lines). As the MACD has fallen, the histogram hasn't confirmed that, has moved higher, and is ready to cross above its signal line on any rally. Something very important about bullish divergences: they're totally meaningless without PRICE moving higher. The first bullish divergence (Green #2) was when the UYG tried to double-bottom at 24.00. It was a deadly "buy signal" for anyone who bought that bullish divergence.
The UYG needs to take out the top of The Rectangle, at 19.81-19.82.
Wednesday, July 9, 2008
UYG: Symmetrical Triangle Breakdown
(Click On Charts To Enlarge)
A Symmetrical Triangle broke down at 19.83 at 2:00 PM, putting 18.62 IN PLAY. I shorted the breakdown, but given how beaten up the sector is, I didn't have much appetite for the trade, in case it was a fakeout. I covered for a quick profit of just under $600, but I would have been fine hanging about for more downside. The UYG currently is at 19.00.
Tuesday, July 8, 2008
UYG: Rally To 20.52-20.53 Resistance
(Click On Chart To Enlarge)
From June 30:
"Former 20.52-20.53 support "should be" resistance on a retest. It was. That's a failed retest, and short-term, 20.52-20.53 now is validated resistance."
Basis the 10-Minute chart, the UYG broke out of a channel near 19.22 in late afternoon trading which put an upside target of 20.44 IN PLAY, just below 20.52-20.53 resistance. The target got MADE very quickly after the breakout. Nice rally with the close at the high of the day. The UYG now has got a very decent chance at least to fill the 22.54-22.97 gap from June 26 in the daily chart.
Friday, July 4, 2008
SKF: The "Shadow" Bullish Wolfe Wave
(Click On Charts To Enlarge)
From May 3 comments:
"The Bearish Case For Financials:
1. Where the Bullish case would fall apart is if we've got a False Breakout in the UYG and a False Breakdown in the SKF.
Chart #2 shows the possibility of a Bullish Wolfe Wave in the SKF, which would be bearish for financials since it is an ultrashort fund."
UPDATE: Chart #2 from May 2 now is Chart #1 above. The Wave #5 Fakeout that we discussed back then turned out to be the EXACT low for the move down in the SKF. Interesting how the patterns in the UYG and SKF have played out over the past two months.
While all four pattern targets in the UYG have MADE (see "UYG: The Three Bears: Final Chapter" post below) and it plunged 49% from its May 2 high, the SKF ended up rallying in what I would describe as a Bullish Wolfe Wave "shadow effect" in terms of the Target Line (#6). See Chart #2 above. First time I've ever seen that.
By creating a parallel line and anchoring it to the May 2 low, we can see that once it got going to the upside off the Wave #5 Fakeout low, it rallied even more sharply than the original Wave #6 target line, and has rallied a sizzling 84.2% in just two months time from the May 2 low to this week's high.
While this isn't a classic Bullish Wolfe Wave since the SKF hasn't hit the target line (#6), it sure helped with indentifying the direction. The rally was "late" in developing in terms of tracking the original target line, but it went up like a rocket and recently has put on the booster rockets, rallying well above the "shadow" target line.
That reminds me...Happy 4th of July ;)
TYPO: Chart #1 from May 3 should read "Possible Bullish Wolfe Wave," not Bearish.
Wednesday, July 2, 2008
XING: 4.11 Crash Target MADE
(Click On Charts To Enlarge)
I've posted on XING more than on any other stock, and I'm sorry to see this Crash Target of 4.11 from July 17, 2007 get MADE, two weeks shy of the Crash anniversary.
Since the Crash, a total of 19 targets on the upside and the downside also have MADE, so it's been a great trading stock, but most of the targets have been on the downside. XING has had many, many chances to turn this around, but it has been one of those value traps with a ridiculously low P/E ratio (probably 2 or 3 now), due to the fact that management has done little or nothing to improve its transparency and to instill shareholder confidence.
What a shame, and what a terrible disservice to XING investors.
UYG: The Three Bears - Final Chapter
(Click On Charts To Enlarge)
The Three Bears showed up in mid-May, and the last of The Three Bears targets, 19.05, got MADE in yesterday's trading, so that particular story is finished.
As trading unfolded, The Bearish Rising Wedge "morphed," or changed into a Bearish H&S Top, seen more clearly in Chart #2, so we had The Three Bears...Plus One ;)
The H&S Top target of 19.74 got MADE at the open yesterday, on the way down to the 19.05 target. Often when there are multiple chart patterns like this, the move can be very dramatic in terms of percentage move, and swift in terms of time, as this move down was. From mid-May when Bear #3 (The Bear Flag in blue) broke, the smackdown was roughly 40% in about six weeks time.
Tuesday, July 1, 2008
UYG: Bearish Symmetrical Triangle
(Click On Chart To Enlarge)
From yesterday:
"...short-term, 20.52-20.53 now is validated resistance."
This morning's rally high was 20.47, so that's still resistance. Basis the 1-Minute Chart, the UYG broke below a Symmetrical Triangle at 11:07AM, at roughly 20.02, which put a target of 19.47 IN PLAY, so a retest of the morning 19.48 low. That doesn't mean we'll get there, but that's what the breakdown suggests unless/until the UYG gets above the failed retest high of 20.07, then next resistance at 20.20, the last high of the pattern at #5.
Math for the target:
20.47 - High of the pattern
19.92 - Low of the pattern
20.47 - 19.92 - 0.55 subtracted from the break at 20.02 - 0.55 = 19.47 IN PLAY.
XLF And BAC: Targets MADE
(Click On Charts To Enlarge)
From June 17:
"If the Double Bottom doesn't hold... I'd sell if I were long (I'm not at the moment)."
In the XLF, the Double Bottom broke on June 20. The H&S Top target of 20.45 MADE on Friday, June 27. The Bearish Rising Wedge target of 20.25 MADE yesterday, so those are out of the way now.
"BAC currently is trying to rally back to broken support at the gap...Meanwhile on the downside, 23.62 still is IN PLAY, a measured move off the Symmetrical Triangle breakdown.
BAC's 23.62 target also got MADE in yesterday's trading. The decline off the May 2 Bearish Rising Wedge high (Red #4) has been particularly brutal. Almost no rally during the 45% "dead drop" from May 2 to yesterday's low, which looked like some capitualtion (see the 1-minute chart) at the close. BAC dropped more that $1.00 right before the bell on big volume, if that bar is accurate. It was 3,093,994shares traded. One or more players might have wanted BAC off their books at the end of the quarter.
Subscribe to:
Posts (Atom)