Tuesday, September 20, 2011

GDX And GG


From rhe weekend, on the GDX:

"The bottom of The Channel comes in on Monday, September 19, at 64.05. Friday's close was 64.11, so the GDX is "right there."

The GDX opened yesterday's session "right there," at 64.07, then ran further into The Channel, to 64.76, a penny above the September 13 high of 64.75.

That early move higher gave The Bears a bit more of "Ye Olde Knuckle-biter" with the GDX continuing its rally back inside The Channel and with it also taking out that high, but that nominal takeout of the 64.75 high by just a penny was a Bull Trap. The rally was over right there, at 9:42AM. The GDX sold off and closed back below The Channel.

Key Resistance levels in the GDX now are (1) the bottom of The Channel, which comes in today, September 20, at 64.395, and (2) 64.76 - 64.75, the September 13 and 19 highs, respectively. An upside takeout of both likely would give The Bears another chew at their knuckles ;)


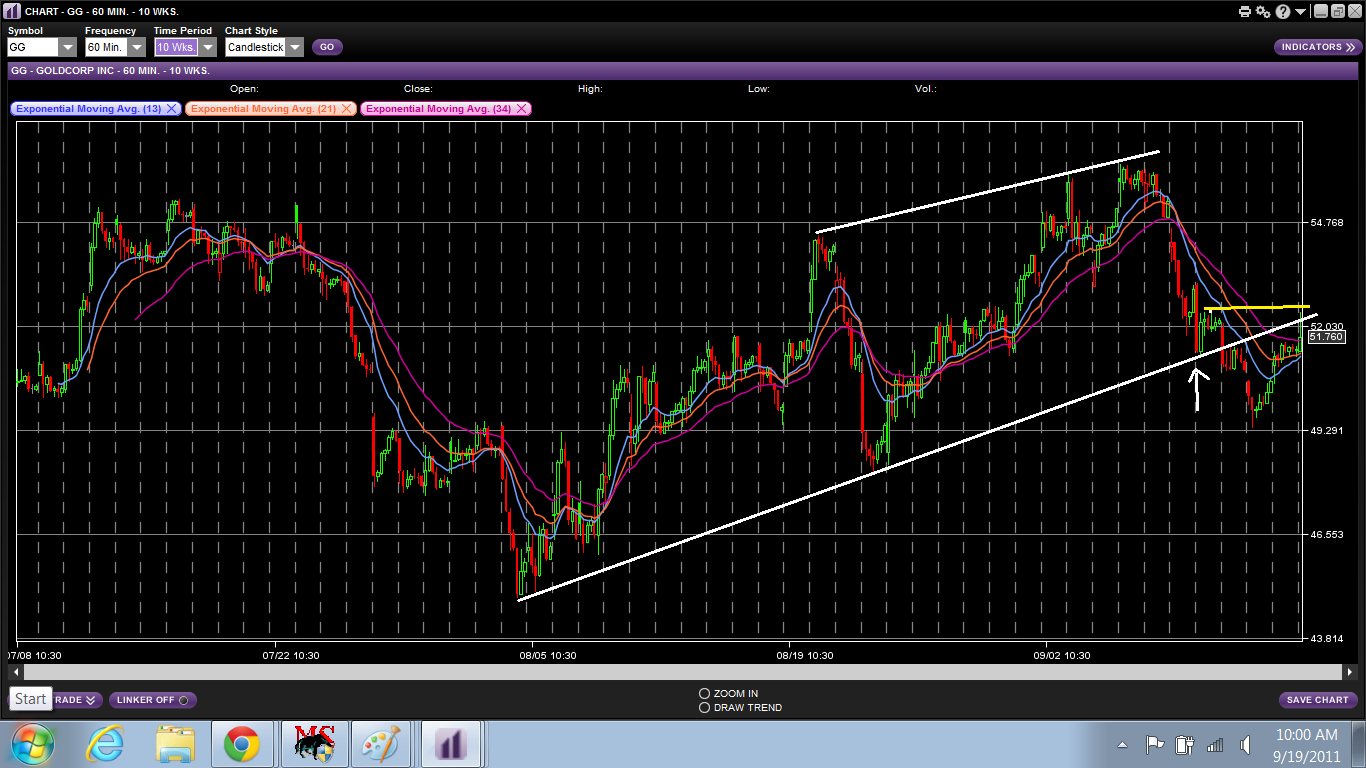
I was more interested yesterday in shorting GG. It had fallen below its rising Channel and, unlike the GDX, hadn't regained it in Friday's session. The bottom of it came in yesterday at 52.239. Since it was rallying with the GDX in the early going, I decided to put in an order to short 5,000 shares of it at 52.38, just below 52.425 horizontal resistance in the Hourly chart.


I caught the session high of 52.40, within two cents.


GG put in a little Double Top and sold off quickly to the EMAs in the 1-Minute chart, so I covered the short and planned to re-short it on the next rally since it had managed to get above resistance at the 52.239 bottom of The Channel in the daily chart on the early rally.


I didn't get the rally. GG initially sold off and found support (yellow arrow) at the top of Friday's late session triangle (in white). I was wanting to short a gap-filling rally (horizontal red line), but it was no good. The Bulls didn't have it in them, and after a brief rally, GG broke below the bottom of Friday's late session triangle.


After that breakdown, The Bulls staged a failed Bearish Rising Wedge (in yellow) reflex rally back to the bearishly inverted EMAs, then they formed and broke below a Bear Flag (in orange). At the gong, The Bulls were trying to break out of an Ascending Triangle (in blue), the highs of which are 50.90 and 50.89, respectively.


The bottom of the broken Channel in GG comes in today, September 20, at 52.478.


Gain: $1,500

Saturday, September 17, 2011

GDX Rally - FCX Selloff


From yesterday morning:

"We know that "Retests of broken support are common, and are to be expected," so I'll try to keep that broken trendline in the GDX on the radar. It comes in today, September 16, at 63.6875."

I shorted 5,000 GDX yesterday morning, at 63.68 Channel resistance. I didn't want to stay very long, though. I covered fairly quickly, at 63.45, as the GDX moved down to find support at the EMAs. One of the reasons for my "hit and run" play was that The Bulls broke out of this triangle, which put 63.79 IN PLAY, just above my short entry. That breakout in the very short-term 1-Minute chart didn't concern me much, but...


...in the Hourly chart, The Bulls also broke out of this Falling Wedge, so that was TWO bullish breakouts in the two different time-frames. That concerned me.

Generally speaking, the longer-term daily chart will trump the Hourly and shorter-term charts, but there's no "always" in the stock market. I didn't like being short that kind of near-term strength and anything above 63.68, which was the bottom of The Channel in the daily chart, was "Ye Olde Knuckle-biter" for the shorts, and I was one of them. I took the money. More like grabbed the money ;)


It was a good job of it that I did because after I covered, the GDX formed and broke out of a Bull Flag (pattern in yellow), then moved higher and held up all session.


In the daily chart, The Bears now have "Ye Olde Knuckle-biter" with which to contend. They are left wondering about The Channel breakdown since the GDX closed back inside it on a 3-day pattern that "looks like" a Bullish Morning Star. That pattern normally shows up only at bottoms, but regardless of what we call it, Thursday and Friday were a pretty nice recovery after The Bulls got smacked out of The Channel.

The Recovery could be one of those "One Day Wonders," back inside The Channel, to test the mettle of The Bears, who obviously need to break The Channel again, then take out the 61.35 low of Thursday's Bullish Hammer.

The bottom of The Channel comes in on Monday, September 19, at 64.05. Friday's close was 64.11, so the GDX is "right there."


Another signature "Gap And Crap" opening for FCX. Have mercy!

The initial plunge in the first minute of trading didn't break 42.35-42.36 "last horizontal support" from Thursday afternoon (the top yellow horizontal line in the next chart), but after a brief rally, 42.35-42.36 support got taken down. UGH. I shorted 5,000 shares of it, at 42.56, on the next rally to the EMAs.


The Bulls staged a Bearish Rising Wedge rally (pattern in white) in an attempt to get back to the opening high, but it was no good. The pattern broke down, putting 42.15 IN PLAY.

42.90 - High of the Rising Wedge
42.30 - Low of the Rising Wedge

42.90 - 42.30 = 0.60 points of downside from the breakdown at 42.75.

42.75 - 0.60 = Target: 42.15 IN PLAY

42.24-42.25 was next horizontal support, so I covered half of my short position going into it, at 42.26.


I really, really didn't want to cover the other half when the 42.15 target got MADE since important 42.24-42.25 support just had been broken and the stock looked marked for a move toward Thursday's 41.50 low, but since Ms. Market punished me on Thursday for NOT "taking profits, or at least 'some' profits, when targets get MADE," I covered the remaining half at 42.15, even though I had covered half already, and planned to re-short the next rally.


CURSES!!! No rally. A dead drop to Thursday's 41.50 low, exactly. "Damned if you do...damned if you don't." LOL.

Oh, well...remember to be grateful for whatever Ms. Market gives you, Melf!

The trades were filled in such small batches (pain in the $#$%), I had to take two screenshots to get them all on there:


Gain on the session: $2,900

Friday, September 16, 2011

GDX And FCX


I noticed before the open yesterday morning that the GDX had validated the bottom of The Channel TWICE, and that it was perilously close to breaking twice validated support.

Given that the slope of that trendline rises at about thirty-four cents a day, any opening in the GDX yesterday that wasn't a Gap Up would be a technical violation of the trendline. I was interested in shorting it, although I forget if Scottrade will allow it, and was going to enter a "tester" order, but...


... the GDX opened on a Gap Down, below The Channel. Never mind.

We know that "Retests of broken support are common, and are to be expected," so I'll try to keep that broken trendline in the GDX on the radar. It comes in today, September 16, at 63.6875.


In FCX, The Bulls tried to overcome the 42.24-42.27 resistance that we discussed yesterday by throwing the "long bomb," with a Gap Up opening to the 42.48 yard line, the short-term result of which was a signature "Gap And Crap" opening. UGH.

That play got called back to the line of scrimmage (a full retracement of the gap from the prior day's close) and then some penalty yardage tacked on to that for attempting to bully their way through resistance. LOL.

The Bulls needed to establish the running game (solid chart structure), and they did.


Coming off the morning lows, The Bulls climbed steadily higher, put in this Triangle, the LOWS of which were in the 42.24-42.27 resistance area, then broke out of it and headed for the opening high of 42.64, which went IN PLAY off the pattern's measured move.

Before going for that score, however, The Bulls did the smart thing and came back to retest the top of the Triangle, to validate it as support. Lovely. I bought 5,000 shares of FCX at 42.41.


Coming off the trendline validation of support at the top of the Triangle, The Bulls formed and broke out of another triangle (in orange), which also put a retest of the morning high of 42.64 IN PLAY. Alright ... Go Bulls!!!

Normally, I like to "take profits, or at least 'some' profits, when targets get MADE." If there had been only one pattern breakout, I would have cashed it in when the 42.64 target got MADE. I considered selling half of my position, but I liked The Bulls' game plan execution so well, I held all of the shares for a possible late day gap-filling rally toward...


... the 44.00 gap, fueled by the breakouts and some possible short-covering. I raised my stop to "anything that was back in my face," below 42.48-42.49 horizontal support.


CURSES!!! The rally rolled over and died.

The top of the orange triangle, 42.58, wasn't support (top yellow line).

42.48-42.49 horizontal support (bottom yellow line) wasn't support.

The stock was back in my face. Wimpy Bulls! I threw it in on the break of 42.48-42.49 horizontal support. UGH.

Have I mentioned, "Take profits, or at least 'some' profits, when targets get MADE?" LOL. Serves me right. I "shoulda" sold half of my position when the 42.64 target got MADE, but I got greedy. I should slap myself for that.

Slap! Slap! SLAP!!!

Ouch! Ouch! OUCH!!!!


The session finished with The Bulls finding support at the 42.35 low of the orange Triangle (the late afternoon low was 42.36).


Pitiful gain: $150

Thursday, September 15, 2011

SSO And FCX


The session in the SSO began with a Wolfe Wave 5 Fakeout/Breakout to the upside, followed up by an immediate plunge to the Wave 6 target line. Done!


That was followed up with an Ascending Triangle upside breakout, a successful retest of that breakout, and then another pullback to the breakout. Hmmmm-mm...that looked real decent for The Bulls.

I decided to get long 5,000 shares at 40.96 (white arrow), but as is often the case, they wouldn't let me have it. 40.96 was the exact low right there, and as it rallied again, I could see that "they" were going to make me pay up for it. I modified my order to a limit of 41.16 and got filled at 41.14.

That order modification cost me an extra $1,000, but I didn't mind paying it with the SSO looking so strong coming off the Ascending Triangle breakout validation, the target of which was 41.56.

Ascending Triangle Math:

40.90 - the more conservative of the 40.90 and 40.91 highs.
40.24 - the Ascending Triangle and completed Wolfe Wave target low

40.90 - 40.24 = 0.66 points of upside added to 40.90

40.90 + 0.66 = Target: 41.56 IN PLAY


The SSO then put in a neckline and a Right Shoulder (both in yellow) of an Inverse H&S and broke out of that to the upside, putting a target of 42.06 IN PLAY. The neckline highs were 41.17 and 41.15.

41.15 - 40.24 (low of the Head) = 0.91 points of upside.

41.15 + 0.91 = Target: 42.08 IN PLAY

I sold 2,500 shares at 40.60 when the 41.56 target got MADE. My plan was to hold the remaining 2,500 shares and see if it looked like the 42.08 target also would get MADE, but...


I talked myself out of it, based on the fact that Gap Resistance in the Hourly Chart (horizontal white line) began at 41.71. I decided to "take the money."


Curses! The two little pattern breakouts (in orange and in red) gave the chart additional strength, and the Inverse H&S target of 42.08 got MADE, and then some! The session high was nearly a dollar higher than that target, at 43.07.

If I had held, though, I would have sold at the 42.08 target.


SSO trades.


FCX has been getting kicked around, and lagged the general market all day. Late in the session, though, it was slow-w-wly making progress back toward 42.24 - 42.27 resistance, and was hugging the EMAs on the way up.

I bought 5,000 shares of it for 41.91 (white up arrow) and sold it for 42.26 (white down arrow), at the 42.24-42.27 horizontal resistance.

FCX sold off from that retest of resistance, which now is validated resistance, but The Bulls have something to work with if they can bust through it.


Gain on the session: $4,100

Wednesday, September 14, 2011

SSO And AMZN


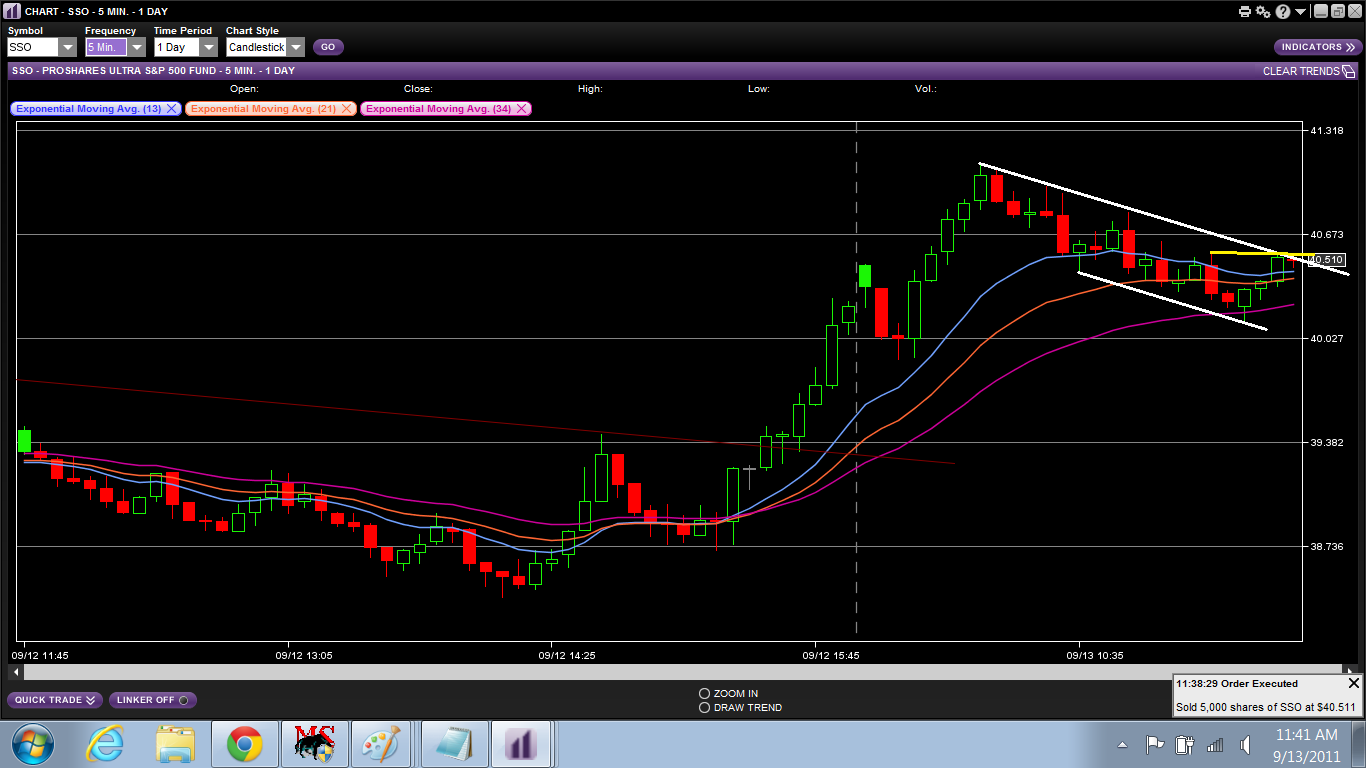
On the strength of Monday's strong performance and yesterday morning's opening rally, I bought 5,000 shares of SSO at 40.28 on the pullback to the EMAs in the 5-Minute chart. Initial resistance was the top of the channel (in white) and horizontal resistance (in yellow), at 40.54. I sold the shares just below there, for 40.51.


Nice consolidation and Falling Wedge breakout in AMZN. The highs at the horizontal yellow line were an identical 216.60. The low of the Falling Wedge was 215.40, so I expected a minimum rally to a target of 217.80 and bought 1,000 shares at 216.75 and another 1,000 shares at 216.50.

216.60 - Identical highs
215.40 - Low of the Falling Wedge

216.60 - 215.40 = 1.20 points of upside added to 216.60 = Target: 217.80 IN PLAY

The highs at the orange horizontal line were 216.95 and 217.00, a breakout above which would put an additional target of 218.50 IN PLAY.

216.95 - the more conservative of the two highs
215.40 - the low of the Falling Wedge

216.95 - 215.40 = 1.55 points added to 216.95 = Target: 218.50 IN PLAY


I sold all 2,000 shares going into the 217.80 target. My eyes were too tired to sell half and hold the other 1,000 shares for the 218.50 target, which would have given me a real decent chance at a better gain.


After I sold (white down arrow), AMZN formed and broke out of two Bulls Flags (white up arrowss). 218.50 got MADE and the stock scored an eventual session high of 219.95, capitalizing on the nested pattern/multiple pattern breakouts. Quite nice.


Gain on the session: $3,450

Tuesday, September 13, 2011

SSO - Late Day Double Breakout


From yesterday morning:

"If the SSO opens as indicated, first resistance would be 39.244-39.25, which would become DOUBLE resistance. The former is where the broken bottom of The Channel comes in today; the latter was Friday's low. The Bears will want to defend that level on any reflex rally."

I shorted SLW and the SPX (via the SDS) on the reflex rally off the Gap Down opening, but The Bears didn't defend 39.244-39.25 resistance and allowed The Bulls to fill the opening gap entirely. Yeesh. I didn't like that at all, so on the next selloff, I threw in the SLW short trade and sold the shares of SDS.


As it turns out, I would have been fine holding both positions through the next selloff, which took out the opening low, but late in the session The Bulls came on strong and broke out of this Channel (in white), which contained a nested Falling Wedge (in yellow). As we know, those nested patterns can pack some punch on a breakout or breakdown, as this one did.

At the yellow arrow, The Bulls successfully retested the Falling Wedge breakout, the EMAs got properly threaded and from there, it was The Bulls, going away, into the final gong.


Gain on the session: $1,400

Monday, September 12, 2011

SPX And SSO


From September 7 on the SPX Aad SSO:

" In both of these charts, the lower trendlines now are validated trendlines with yesterday's third "hit," confirming that they are support. If they get taken down, it suggests at least some kind of retest of the lows."

The SPX violated the bottom of The Channel by about a point on Friday, but closed within it by a few points, settling at the lower end of the day's trading range. This morning, the index is indicated to Gap Down, below The Channel.


The SSO held inside its Channel on Friday, but currently is indicated at BID: 38.67...ASK: 38.76, well below The Channel, and bracketing the September 6 low of 38.71, which was a trendline validation of support.

If the SSO opens as indicated, first resistance would be 39.244-39.25, which would become DOUBLE resistance. The former is where the broken bottom of The Channel comes in today; the latter was Friday's low. The Bears will want to defend that level on any reflex rally.

Saturday, September 10, 2011

SLW: Broken Support At 40.74


From yesterday morning:

"Why in the world would The Bulls let The Bears bring it all-ll the way back to 40.74 after TWO little upside breakouts (the red arrows)? UGH.

ANSWER: Because The Bulls had run out of spinach, and 40.74 wasn't going to hold."

This chart is as of Thursday's close, with The Bears having knocked out 40.74 support after The Bulls had TWO failed upside breakouts.

Friday's open...


...Gap Down to 39.83, then a quick rally to 40.62.

The reflex rally came so fast, I fumbled placing my order to short 2,500 shares at 40.55, just below horizontal resistance at 40.57. I typed 40.45, and that's where I got filled.

I expected at least a 50% retracement of the reflex rally off the Gap Down low, which was 40.18, and I covered the short just ahead of that, at 40.23, looking to get better positioned short if SLW rallied again.


I got short again at 40.54. The Bulls had broken out of the little triangle (pattern in white), so I covered the short going into the retest of the top of the pattern (white arrow) in case the retest was successful, and planned to short it a third time if The Bulls tried to rally it.

The retest was unsuccessful and failed to produce another bounce, so I decided to call it a day.


Too bad that I didn't hang about a little longer because there was another excellent shorting opportunity off that little triangle.

Notice how (triangle at the left of the chart):

1. The retest of the top of the triangle failed at the first down arrow
2. The bottom of the triangle broke at the up arrow
3. The retest of the bottom of the broken triangle failed at the second white arrow, validating it as resistance.

The Bears delivered the 1-2-3 Punch, and down she went.

The Bulls tried to establish something at the end of the session. They broke out of a mini Ascending Triangle (in yellow) that is nested within a Channel (in white). The clock expired with The Bulls defending the top of the Ascending Triangle, at 39.85.

The session high was 40.72, just below broken support at 40.74 in the first chart above.


Gain: $900