Sunday, July 17, 2011

ARIA: The Gravestone Doji Revisited


Remember the Bearish Gravestone Doji Star that we looked at back in March, that looked suspiciously like The Bears were going to get squeezed when ARIA rallied right back to 7.30 in the next session?


The Bears, indeed, got squeezed, then a second Bearish Gravestone Doji showed up.


The Bears got squeezed again, then there was a selloff, followed by a rally into a Bearish Long-Leggetty Doji.


Now, QUIT IT. Tha-a-at really looks bearish!


Nope. Not bearish yet. Imagine relentlessly shorting all of those "bearish" looking candlesticks all the way up! Some stubborn players actually do that, which helps to propel the stock ever higher. Yeeks!

Market Lessons:

1. It's fine if we short any scary-looking candlestick that "looks" bearish and "looks like" a top (or the reverse in a downtrend), but let's not be stubborn about it. If the high of the candlestick or candle pattern gets taken out to the upside, GET OUTTA THERE. Forget whatever opinion we have about why a stock "shouldn't" be rallying 100%...200%...300%, etc., and give strong consideration to getting long the stock. Repeatedly shorting a stock like this one will do serious damage to a portfolio. UGH.

2. Don't infer too much from a single candlestick, or even a series of candlesticks, like in early June (the Long Leggety Doji Star, followed by the Bearish Engulfer). Again, shorting that is fine, but we don't want to stay short when Ms. Market clearly tells us that $10.00 isn't the high, as she did.

3. A trend in motion tends to stay in motion and a stock can have HUGE percentage gains in the process, like ARIA has had.

Friday, July 15, 2011

GOOG: Return To The Scene Of The Crime


I found it interesting to see GOOG trading in after hours in the 595's, up $66 from the close, on an earnings beat.

595.19, to the exact penny, was the April Fool's Day "Scene Of The Crime," when GOOG:

(1) Failed at the 595.19 retest of the secondary low of the Descending Triangle (pattern in black)
(2) Failed at the top of the Rising Wedge (pattern in blue)
(3) Failed below Kumo (Cloud) overhead resistance (vertical red lines)

If there's such a thing as a "perfect entry," shorting GOOG coming off the April Fool's Day failure at 595.19, given that "body of evidence" at validated resistance, would be an example of one.

Additional very good entries short were:

(1) The breakdown of the Rising Wedge
(2) The failed retest of the Rising Wedge, three days later
(3) The Breakaway Gap Down out of the H&S Top on April 15
(4) The Breakdown of the Ascending Triangle, on May 13 (red up arrow)

As we've witnessed in recent posts on stocks like BIDU and AMZN, there's such a thing as "staying too long at the fair" when stocks are nearing, or at, targets or support or resistance, after a breakout or a breakdown.

The last downside target of 116.02 in BIDU got MADE on June 16 (the low was 114.14), prior to the stock ripping to the upside, to 148.44 on July 7.

After a sizeable selloff, AMZN bounced off DOUBLE validated support at a low of 181.59, then the Bullish Inverse H&S Bottom target of 215.86 finally got MADE on July 6.

The H&S Top target in GOOG did not get MADE, but there was plenty of profit to be had on the short side on the three pattern breakdowns, and there were signs that the 461 target would not get MADE when the stock began to make "higher highs" above 493.94 and above 506.69 (the horizontal blue lines with stop signs), knocking out some stops on the short trade.

The July 5 Gap Up into the Kumo (Cloud), from 521.28, was NOT filled during the formation of the Symmetrical Triangle (pattern in black) inside the Kumo. The first attempt to get through the Kumo resistance at Black #1 failed, which often is the case on the first attempt. At yesterday's close, Data Point #4 (Black #4) of a Symmetrical Triangle was established, so GOOG was "good to go" on any upside takeout of Black trendline #1-#3, which would be a Symmetrical Triangle breakout, as well as a breakout above the Kumo (Cloud).

ANYTHING can happen on the reporting of earnings. Although the chart was "good to go" on the upside, it certainly wasn't "predicting" that the earnings would be a beat. If the earnings had been a miss, GOOG could be gapping down below the Kumo (Cloud), instead of above it.

If this morning's Gap Up were a Breakaway Gap up out of the Symmetrical Triangle, into the 540's, I would consider that very playable on the long side. But, a Gap Up "Return To The Scene Of The Crime," near 595? She's gone on the upside!

Nice for The Bulls. Brutal for The Bears, if they "stayed to long at the fair" and didn't cover their positions. They've given back all of their gains if they shorted near the April Fools' Day failure at 595, and they're under water, after holding a big winner, if they held short any of the breakdowns that followed. UGH.

"Never let a big winner turn into a loser." Ratchet down the stops (the recent blue horizontal lines) and don't be stubborn about insisting that targets will get MADE. Targets only indicate direction and are "what we're aiming for."

Rats! I can't end on a preposition. Okay. "...for what we are aiming?"

Reminds me of a joke. A southern girl and a northern girl are seated together on an airplane:

Southern Girl: So-o, where y'all from?

Northern Girl: I am from a place where we do NOT end our sentences in a preposition!

Southern Girl: Oh. So-o, where y'all from, BITCH?!"

Thursday, July 14, 2011

FCX: The Double Bottom


From yesterday morning:

"When FCX took out the 54.41 and 54.42 highs of the Ascending Triangle, it was a QUADRUPLE breakout on the session, with 55.37 IN PLAY from the Double Bottom breakout."

On Tuesday's pullback from the gap-filling high, the top of the Ascending Triangle/Rectangle "should have been" support. It wasn't. FCX fell through it, then failed an attempt to get back above it (the down arrow), so it became resistance again. That resulted in a selloff to the bottom of the pattern, a slight downside violation of the lows and a close just about smack on the lower trendline (the first up arrow).

That "looked like" FCX might be headed lower yesterday morning, but it was a Bear Trap close on Tuesday. THE TELL that it was a Bear Trap was:

(1) The opening Gap Up, back above the top of the pattern
(2) The pullback to the top of the pattern (second yellow up arrow) which held, indication that it now was support as it "should have been" on Tuesday.
(3) The upside takeout of the early morning high.

The Bear Trap was sprung and the short squeeze was on. In addition to The Bears having to "Buy To Cover," as the stock began to move up toward the early morning high, The Bulls could see that they weren't going to get a fill of the morning gap, so they stepped in to buy, as well. The proverbial "everyone" was a buyer coming off that successful validation of support at the second yellow arrow, as the stock raced higher.

The Double Bottom target of 55.37 got MADE, with some extra on the upside, confirming the bullishness of Tuesday's QUADRUPLE breakout.

Wednesday, July 13, 2011

FCX: Quadruple Breakout To Gap Resistance


Last week, FCX enjoyed a nice rally off the June 28 Triple Breakout through Triple Validated Resistance, during which six pattern targets got MADE. The next Falling Wedge target of 56.49 was not achieved during that rally, at least in part, due to the fact that...


...FCX ran into resistance at the top of the BIG 2011 Falling Wedge, at 56.12. Technicians watch those trendlines and the fact that it was hit within less than one penny indicates to me that traders were on it.

When there's intervening resistance like this, ahead of a target (the 56.47 target, in this case), it's not a bad idea to take at least some profits, or even to short at resistance, which I did, at 56.09, just below below where the trendline came in on July 7, at 56.12 (see real-time execution posted last week). It's good to be aware of trendlines, support, resistance, etc. in advance, so that we're prepared to take action.


The July 7 Gap Up and rally was from a close of 53.52 in the prior session. I wanted to get long FCX if that gap got filled, which it did.

In Monday's session, I purchased only 1,000 shares, at 53.58, just above the gap, in case the gap didn't get filled entirely. Given how bullish the June 28 breakout was, I wanted in, but not with a lot of shares just yet.


In yesterday's session, I bought much more aggressively, in both accounts, when I saw the Double Bottom break out above the horizontal white, and the Bull Flag (pattern in blue break out). Later on in the session, a Symmetrical Triangle formed (pattern in orange), which ended up being "nested" within an Ascending Triangle (pattern in yellow), so there were four intraday patterns.

Notice that after FCX put in the second high at the top of the Ascending Triangle/Rectangle, it pulled back and found support at the top of the Symmetrical Triangle (orange arrow). "Former resistance became support" and FCX was good to go. It exploded to the gap from that validation of support.

When FCX took out the 54.41 and 54.42 highs of the Ascending Triangle, it was a QUADRUPLE breakout on the session, with 55.37 IN PLAY from the Double Bottom breakout.

Math for the Double Bottom:

54.21 - the pivot high of the "W"-Bottom, or Double Bottom
53.05 - the more conservative of the 53.02 and 53.05 lows.

54.21 - 53.05 = 1.16 points of upside on a takeout of 54.21.

54.21 + 1.16 = Target: 55.37 IN PLAY

Remember what we just said about "intervening resistance" on the way to a target? The horizontal red lines represent gap resistance, from 54.73 to 55.02. Because of that resistance, I shaved my upside expectations and sold all of my shares in the 54.90's below the 55.02 top of that gap resistance, and was VERY glad that I did.


The session high was only 55.08, shy of the 55.37 Double Bottom target IN PLAY, then FCX sold off a dollar into the close. If I had gotten greedy and had not respected the nearby gap resistance area, I would have given back just about all of my gains. UGH.


I bought another 1,000 shares yesterday in this account, then sold all 2,000 shares (1,000 shares from Monday) at gap resistance.


Bought and sold these shares yesterday.

Gain on the session: $3,650

Tuesday, July 12, 2011

DNDN: Ye Olde Knuckle-Biter


For lack of a better term, when a stock breaks out (or breaks down), then closes back inside the pattern, I call that "Ye Olde Knuckle-biter," because we're left wondering how sincere the stock was about the breakout (or breakdown), and whatever target that is IN PLAY goes ON HOLD until we see what develops.

After the big black candle of June 30, the low of which was 39.22, there was news having something to do with the government paying for DNDN's Provenge drug, a treatment for prostate cancer, which is very pricey. Something like $93,000 for four treatments, but definitely check me on the facts, if you're interested in the fundamentals. I'm only interested in the market's REACTION to the fundamentals, so I could be wrong about that.

NOTE TO YOU GENTS: My understanding is that prostate cancer is one of the most treatable cancers, if detected early. It's a very good idea to have both the physical and PSA test annually. If you're put off by the physical test, think about what women have to go through during their lifetimes with all of the poking around, etc. It's not a big deal, so DO IT. (My brother-in-law has Stage 4 prostate cancer. He never went for the tests. God bless him).

Back to bidness...

The market's REACTION to the news was to break the stock out of a Symmetrical Triangle, two sessions later. The breakout held in the next session, but in the following session, DNDN finished back inside the Symmetrical Triangle for a "Ye Olde Knuckle-biter" close.

Technical analysis doesn't TELL US what to do. It only gives us information, and in this case, the information is, "There is evidence that the upside breakout of this Symmetrical Triangle "could be" a Fakeout/Breakout. The upside targets are ON HOLD as long as the stock remains below the breakout. What would we like to do about that?"

That's a money management decision, and it's up to the individual to make that determination, but it's important to have a stop loss in mind, in case the stock goes south so that we don't become bagholders (I think that I dislike that term so much because I've been a bagholder too many times...LOL).

Some players will give it another day, then sell if it closes back below the breakout a second time. Others will use the 39.22 low of the June 30 candle as their stop loss. Others simply will throw it in on the first close back inside the pattern, for a small loss. If the stock breaks out again, it always can be bought back and turned into a gain, given that the upside targets that would be back IN PLAY.

Taking a loss never is fun, but consider it a part of doing business. There's no getting around it. We WILL have losses, but if we employ sound money management skills, our gains will exceed our losses. Be objective and view it as "the trade went wrong," not as "We are wrong." It's best to get the emotions out of there.


Yesterday's close of 39.20, two pennies below the June 30 low of 39.22, was downright evil because it makes it very difficult to defend being long an upside technical breakout when the stock has closed below the "good news" low.

The trade also is more than a "Ye Olde Knuckle-biter," with the stock closing well inside the Symmetrical Triangle pattern. Traders who threw it in on the first or second close back inside the pattern are glad that they did, I would suspect. Buying the breakout at 41.56, or higher, now is a paper loss of 5.7%, or more, at yesterday's 39.20 close, so it's become a difficult trade.

Just something to think about. Analyzing charts is one thing. Actually play them is something else altogether and not always easy, as evidenced by this example of DNDN.


A few comments are on this Ichimoku Kinko Hyo chart for Mary to peruse while she sips her morning coffee ;)

Monday, July 11, 2011

SCCO: Channel Breakout


This news was out on July 5, and this is how the chart of SCCO looked at the close on July 6, the day of the meeting with U.S. officials.

"Peru’s Humala Visits U.S. 5-Jul-11 01:50 pm

Peru’s Humala Visits U.S. To Meet With Hillary Clinton; Possibly With Obama

Peruvian President-elect Ollanta Humala is one his way to the United States for a number of high-profile meetings Wednesday in Washington D.C.

In his first trip to the U.S. since winning Peru’s elections last month, Humala will meet with OAS Secretary General JosĂ© Miguel Insulza tomorrow morning and later with U.S. Secretary of State Hillary Rodham Clinton. Mercopress also reported that Humala will meet with U.S. President Barack Obama tomorrow afternoon at the White House.

Peruvian media outlets and other news sources are reporting that Humala will not meet with Obama during his visit to the U.S.

During his meeting with Clinton, Humala is expected discuss bilateral ties and joint efforts between the U.S. and Peru to combat drug trafficking. Peru may soon take over the title of world’s top coca producer from Colombia, according to a report released by the United Nations (UN).

Humala recently completed his first round of foreign visits as Peru’s president-elect, making trips to Argentina, Bolivia, Brazil, Colombia, Chile, Ecuador, Paraguay and Uruguay. Today’s trip will be Humala’s first visit to the U.S."


At the close on July 6, the day of the Talking Heads Of State meeting, the 21/34 RSI was at Bullish Synchronicity, meaning that they had pulled back to a compression with the 21 RSI still bullishly positioned above the 34 RSI. That set up a Buy Signal from this particular indicator if SCCO could print 32.75 on Thursday, a penny above Wednesday's high, and then close higher. It did.


We never want to be unkind and say that a stock has been acting like a dawg. While we love dawgs, we want them to come with four legs, not a four letter ticker symbol. I'm happy to report that I didn't hear SCCO barking at all on Friday, which has been its wont since the H&S Top breakdown in February, 2011 ;)

While sector-related issues were down on the session, SCCO finally broke out of its channel and was up nearly two dollars on the day, capitalizing on the 21/34 RSI Buy Signal issued at 32.75, on Thursday. SCCO started the session down a little, printed a low of 32.61, then went UNCH, then rocketed higher on The Channel breakout.

The stock's REACTION to the July 5 news that there would be a Yap-Yap between The U.S. and the Peruvian muckety-mucks was a yawner. But, the stock's REACTION to the actual meeting, and to other news in the "I love copper...I hate copper" debate was the Channel breakout.

This Channel breakout isn't nearly as bullish as the "flatish" Channel that broke out on September 13, 2010, above which there was very little overhead resistance. Due to the steep declining nature of the recent channel, everything in the channel above here represents nearby resistance, but it's a breakout, nonetheless, on a decent white candle.

Many players who got long Friday's technical breakout (or Thursday's RSI Buy Signal, or Buy Signals from other indicatiors) will use a print below Wednesday's 31.82 as their stop loss. Others will use a CLOSE below that. Others will use a CLOSE back inside The Channel.

If there's an upside takeout of the May 27 "Breakout/Fakeout" high of 37.21, that could bring in some additional buying from The Bulls, buying the "higher high" and also from The Bears who "position played" the H&S Top breakdown, and who have ratcheted down their stops along the way down. That means that each time that SCCO broke down to a new low, those Bears "ratcheted down" their stop to "the last high that preceded the breakdown," each time the stock broke to a new low. That's an excellent way to manage a trade, guaranteeing a profit on the short trade, excluding a horrible gap up, of course, which always is a risk in ANY position, long or short.

The last high before the recent breakdown to fill the August, 2010 gap was 37.21, so The Bulls want to take that out to pressure any existing shorts, and any new shorts in the stock to "Buy To Cover" their postions. The more savvy among the "positioned Bears" already have covered their shorts on Friday's technical breakout near 33.00 or as the stock moved higher during the session, eroding their profit, which would account, in part, for Friday's big white candle.

"Buying Begets Buying." The Bulls bought the breakout. The Bears were pressured to "Buy To Cover" the breakout. That's known as "technical buying." Neither Bull nor Bear was thinking much about any meeting between The Mucketty Mucks, the price of copper, or any analyst's opinion about the price of copper. Both groups were motivated to buy, technically.

I put some additional notes regarding the past year of trading in SCCO on this last chart, for easier reading.

Friday, July 8, 2011

Shorting: FCX And AMZN


FCX has enjoyed quite a rally off the recent low, especially since the Triple Breakout Through Triple Validated Resistance on June 28, where the short trade got busted. On a breakout like that, as we've discussed in the past, "buying begets buying." The Bulls buy the breakout and buy at various points along the way, and The Bears become unwilling buyers, being pressured to cover their losing short positions and any additional short positions that they put on during the rally, so the proverbial "everyone" is a buyer. The "short squeeze" helps to propels the stock higher in the rocket-like fashion that we've witnessed.

"Thou shalt not short a Triple Breakout Through Triple Validated Resistance."

The best time to short is (1) on a breakdown of support, (2) on a retest of broken support, looking for a failure, or (3) on a test of resistance. The reason for that is we will find out fairly quickly whether or not the trade is going to work, without taking much risk. The biggest risk in the trade would be holding the short overnight and having the stock gap up big the next morning.

Shorting an upside technical breakout because we don't think that the stock should be rallying is begging for trouble. Any given breakout or breakdown "could be" a fakeout, but we usually find that out fairly quickly, like the Bearish Wolfe Wave Double Fakeout/Breakout in April. "The Tell" that it was a fakeout came on April 11 (see comment on the upper left of the chart). If the stock breaks out and starts taking out some resistance (see the three horizontal red bars at the recent upside breakout, which represent horizontal resistance), it is unlikely that the breakout is a fakeout, and when short-term targets start getting MADE, which occurred early in this rally, it is VERY unlikely that the breakout is a fakeout.

If we're ever caught out of position short a stock on an upside technical breakdown, recognize the mistake and cover the position as quickly as possible. We especially don't want to compound the mistake by doubling down, tripling down, etc. because we're now overexposed in the trade (holding too many losing shares). While Ms. Market "might" be generous and let us out of the trade at our average price for a break even, she generally punishes us for naughty behavior, like shorting an upside technical breakout.

Rather than "fight the trend," it's better to wait for a shorting opportunity where our chance of success is greater, i.e. (1) on a technical breakdown, (2) on a retest of a technical breakdown, or (3) at resistance. The latter opportunity presented itself at 2:25PM yesterday afternoon.


(1) If, at Wednesday's close, I were FORCED to give an opinion about whether FCX would go up or down in yesterday's session, I would have said DOWN.

(2) If, at Wednesdays close, I were asked if I thought that FCX would rally to the top of the BIG Falling Wedge, I would have said, "Extremely doubtful that it would rally that much during the session, after the nice rally that it's already had."

(3) If, at Wednesday's close, I were asked if I thought I'd be shorting FCX any time on Thursday, I would have asked, "You're joking, right?"

Yesterday:

(1) FCX went up, not down as I would have guessed. WRONG.

(2) FCX rallied to the top of the BIG Falling Wedge, which I didn't think that it could do. WRONG.

(3) I ended up shorting the stock AT resistance, which I didn't think that I'd be doing because I thought that it was extremely doubtful that it would get there in yesterday's session. WRONG.

You see why I have no opinion about what a stock will or will not do next. You also see why I don't make predictions, and why I say that I try to FOLLOW Ms. Market as best I can. My opinions and predictions, if I had them or made them, usually would be WRONG, which is why I say:

"I can't possibly know what Ms. Market is going to do, but what I can know is what I'm going to do about it."

What I did about Ms. Market's unexpected (by me) rally to resistance was short it because we know that over time, we're favored to win more of those trades than lose them, and we're also favored when we structure the trade so that the reward if the trade works out is greater than the risk that we're taking, which in this case, was a mental stop of a twenty cent loss ($500) vs. a targeted gain of about forty cents ($1,000), for a 1:2 risk/reward. I'll take a 1:1 risk:reward if I really like the trade (or if I'm bored to death and wanna play...LOL), but a 1:2, 1:3, etc. risk/reward is much better.


I made a little more than I had planned, due to the fact that this H&S Top emerged, and broke down. The Right Shoulder is unorthodox because it is higher than the Left Shoulder, which it "shouldn't be," but as we've witnessed many times in the past, those often work out fine.

The breakdown put 55.40 IN PLAY. The low in FCX going into the close was 55.48 when time on the clock expired. I covered shortly before the close, not wanting to hold overnight. While the daily chart "looks like" FCX should sell off from validated resistance to fill the gap, you saw how good my opinions and predictions are (NOT!). The chart is bullish, and I didn't want to risk the possibility of staring into a Gap Up breakout through validated resistance in the morning.


Talk about a short squeeze...mercy! What a deceptive move that Falling Wedge was. It "looked like" the Bullish Inverse H&S breakout in late April was a bust, but "The Tell" that the chart still was bullish was the bounce higher off validated support at the bottom of the Falling Wedge, near the Bullish Inverse H&S neckline.

The rally that ensued from that point is a thing of beauty (but, merciless on the shorts). The 215.86 Bullish Inverse H&S target finally got MADE in yesterday's "lucky" 7-7-11 session ;)


Gain on the FCX short: $1,350

Thursday, July 7, 2011

SLW: Ascending Triangle Breakout - Day 2


SLW capitalized on Tuesday's upside technical breakout of the Ascending Triangle with a strong 5% rally on the session.


The Gap Up opening to 34.95 was just below the "bottom rung" of Kumo (Cloud) resistance, beginning at 35.16. There was only a very minor pullback to fill the 34.90 gap left in the daily chart from Monday's high, then SLW began to climb into the Kumo (Cloud) resistance.

There isn't any way to tell in advance whether or not a stock will be successful in getting through the Kumo (cloud), either on the upside or downside.

That said, some factors to consider are: (1) how large of a base (or top) the stock has built, prior to the attempt to get through the Kumo (Cloud); (2) has the stock broken out of a pattern prior to, or during, the attempt; and (3) how thick the Kuno (cloud) resistance is.

Let's look at the January-February attempt to get through the Kumo (Cloud):

1. SLW had built a six-week base, prior to attempting to get through the Kumo.
2. That base also was an Inversse H&S pattern, which was very helpful and it gave the stock a much stronger chance of getting through the Kumo. The Bulls "had game," as it were.
3. Immediately prior to the Bullish Inverse H&S breakout, the Cloud had narrowed to the point that the readings for the top and bottom of the Kumo were nearly identical, suggesting that a big move might be in the offing. The day after the breakout, which was a Breakaway Gap, there was a one-day pullback near the top of the Kumo, then the rally to the 42.43 target, and beyond, ensued.

Currently, with SLW, we've got:

1. a roughly two-week base, which is small.
2. an Ascending Triangle breakout that put 37.43 IN PLAY. That's helpful.
3. Kumo (Cloud) resistance that, as of yesterday's close, ranges between 35.16 and 40.015. That resistance is much more substantial than was the Kumo resistance on the February upside breakout.

Rallying straight through the Kumo here is a more daunting task for the Bulls, and there also is a much larger overhang of supply from the April-June smackdown in the stock. A stronger base from which to launch a good rally would be better. We'll look at an example of how that "could" look in the next chart.

Before we do that, yesterday, we looked at the possibility of the current Ascending Triangle "morphing," or changing, into something bearish, like a Bear Flag, or a Bearish Rising Wedge. Given yesterday's strong rally through the putative top of what would be a Bear Flag, at Black #4, that possibility seems less likely. Bear Flag trendlines aren't always perfectly parallel, so the top trendline "could" angle up a bit and this still "could" end up as a Bear Flag, but we're talking likelihoods and probabilites. The important thing is the bottom of the pattern, which is a validated trendline. That "shouldn't" get violated.


While we want to FOLLOW Ms. Market as best we can, as we did yesterday with considering how the bullish Ascending Triangle "could" turn into something bearish, we also want to consider how the chart "could" be more bullish. Anticipating what "could" occur helps us to be prepared, if it actually does eventuate.

We know that 37.43 is IN PLAY from the Ascending Triangle. We never know whether or not any target will get MADE, but if this one does, or if SLW rallies to anything near it, then pulls back, we've got the posibility of an Inverse H&S pattern that would be larger than the one last winter and a stronger base from which to launch a rally through the Kumo, the top of which currently is at 40.015.

Just a possibility, but it sure would look purdy ;)

Wednesday, July 6, 2011

SLW: Ascending Triangle Breakout


SLW has experienced a rather wicked decline, coming off the Nested Symmetrical Triangle that had a Double Fakeout/Breakout, then "morphed" (changed) into a Bearish Rising Wedge that broke down at 44.44 on April 11, 2011 (best seen in the next chart).

That was followed by four more pattern breakdowns (see the five red arrows) and seven of the eight downside targets got MADE. The last target of 29.28 fell short: the low, thus far, is 28.79, so overall, the pattern targets did a very good job of aiming us in the right direction.

Yesterday, SLW broke out of an Ascending Triangle to the upside, putting a target of 37.43 IN PLAY. Interestingly, that target is very near horizontal resistance at the last highs: (1) the top of the Channel (37.20); and, (2) the high of the last Triple Top (37.67), so the breakout suggests that "it wants to get there," to those highs.

Notice that the rising trendline of the Ascending Triangle was validated as support, prior to yesterday's upside breakout. SLW violated it by only a few pennies, then rallied into the close on a Bullish Hammer (confirmed as bullish by the upside breakout). Ms. Market said, "Yes, that trendline IS valid support, and I'm following it up with a technical breakout." That's an important trendline and we shouldn't want to see it get taken down, like the rising trendline in the Nested Symmetrical Triangle did, at 44.44, on April 11, best seen in the next chart.


On April 5, SLW broke out of a Nested Symmetrical Triangle, meaning that there was a smaller Symmetrical Triangle (in purple) "nested" within the larger one (in blue). The stock faltered at the top of the pattern, closed below it, then broke out again on April 10. April 11 was a deadly candlestick. It not only broke the rising trendline, confirming a "morph" of the Double Symmetrical Triangle into a Bearish Rising Wedge (that pattern is best seen in the first chart above), the candlestick was a rather ugly Bearish Engulfing pattern that engulfed the three prior breakout candlesticks. UGH.

In this chart, I created a trendline that is parallel to the rising trendline in the Ascending Triangle and placed it at the top of the pattern to illustrate what a "morph" into something bearish could look like. The next high wouldn't need to hit that parallel line exactly, but if SLW reverses down from yesterday's high, or makes a high near that top trendline, at #4, then reverses and takes out the validated trendline at the bottom of the Ascending Triangle, that would negate the bullishness of the Ascending Triangle breakout. Just something to watch for.

Also watch for SLW trading back below the 33.61-33.64 top of the Ascending Triangle. If it does, that's "The Knuckle-biter," leaving us to wonder if SLW was sincere about the bullish breakout. It wouldn't necessarily be bearish. SLW could do that and then break out again, but in the interim we're left wondering, thus, "The Knuckle-biter."

Those are "watch your back" concerns of which we always want to be aware with any breakout or breakdown. "How and where could this go wrong?" As the chart stands, SLW is short-term bullish with an Ascending Triangle breakout target of 37.43 IN PLAY.

Tuesday, July 5, 2011

FCX: "Chinese Slowdown To Crush Copper"


I'm not interested in stock market fundamentals, but I'm very interested in the market's REACTION to those fundamentals, e.g, earnings, analyst upgrades/downgrades, news on the economy, etc. You will understand why by the end of this post.

If "good news" doesn't get played out as such in the chart, it ain't good news. Conversely, if "bad news" doesn't get played out as such in the chart, it ain't bad news.

We've had numerous examples during the past several months of "good news" in FCX, the REACTION to which wasn't good. like: (1) numerous analyst upgrades, (2) good earnings, and (3) the May 11 one dollar dividend distribution. FCX still went down on "good news," to a low near $46 in May, and to a low near $47 in June.

We've also had some "bad news" during the past few weeks, the REACTION to which wasn't bad, like (1) Dennis Gartman's June 16 call to sell copper, and (2) Societe Generale's rather grim call on copper, on June 27:

"Things Might Get Ugly For Copper
Gregory White | Jun. 27, 2011, 7:38 AM |


Watch for a Chinese slowdown to crush copper, warns Societe Generale."

Dennis Gartman's June 16 bearish call did result in a one-day selloff in FCX, but the low on the session was a trendline validation of SUPPORT at the bottom of The Bull Flag/Channel and the session was a doji star hammer that was confirmed as a Bullish Doji Star Hammer on the June 28 Triple Breakout. Gartman's bearish call was a low in FCX.

Who knows what the future holds, but it was the shorts who got crushed last week on Societe Generale's call, not copper. As with Gartman's call, FCX sold off the morning of the call (June 27), but that selloff also was a low in FCX, establishing Data Point #4 of the Symmetrical Triangle (Purple #4), nested within the Falling Channel. Intraday on June 27, FCX formed and broke out of a Triple Top/Ascending triangle, and the remainder of the week was up...up...up, off Societe Generale's bad news for a "Chinese slowdown to crush copper."

I don't have a clue whether or not copper will get crushed at some point in the future, like Societe Generale warned early last week, but I do know when I see a bullish Triple Breakout through Triple Validated Resistance, which immediately followed their call, and I do know when I see six upside targets get MADE on "bad news." Those pattern targets are done, irrespective of what happens from here with the price of copper.

You see my point, and it certainly isn't to demean Dennis Gartman or Societe Generale (Dennis has made many fine calls over the years, by the way). I don't criticize others. I make plenty of mistakes of my own. My point is that if we don't see good news or bad news played out that way in the chart, be very suspicious, and also consider fading the market's initial reaction to the news if that's indicated in the chart, like it was on the afternoon of June 27 and on the morning of June 28 when the charts were breaking out to the upside on bad news.

That's known as making a "counterintuitive" play in the market. It's playing something this is contrary to what one would think makes sense: "BUYING FCX when Societe Generale tells us to "watch for copper to get crushed? That doesn't make any sense!" It makes sense if we FOLLOW the chart and ignore Societe Generale's PREDICTION.

Watch the market's REACTION to the fundamentals. Analyst/Guru opinions of the fundamentals quite frequently are "red herrings," i.e., something that distracts our attention from what's really going on, which can be seen in the chart.

Monday, July 4, 2011

4th of July Civic Literacy Exam

The Intercollegiate Studies Institute put out this test on civic literacy. There are 33 questions. See if you can beat my score, which wasn't so hot :(

You answered 26 out of 33 correctly — 78.79 %

Full Civic Literacy Exam (from our 2008 survey)
Are you more knowledgeable than the average citizen? The average score for all 2,508 Americans taking the following test was 49%; college educators scored 55%. Can you do better? Questions were drawn from past ISI surveys, as well as other nationally recognized exams.

Here's the link. Copy and paste it into your browser if it doesn't show up as a hyperlink:

http://www.isi.org/quiz.aspx?q=FE5C3B47-9675-41E0-9CF3-072BB31E2692

Happy 4th, everyone!

Friday, July 1, 2011

FCX: Six Scores For The Bulls


The first two patterns below were intraday patterns on Monday (see Tuesday morning's intraday chart, for review), which preceded Tuesday's Triple Breakout through Triple Validated Resistance.

The last three patterns listed below comprised the Nested Falling Wedge pattern in the daily chart. Nested patterns (my own terminology) are patterns that have one or more smaller pattern "nested" within it. As we've seen so often in the past, when they break out or break down, they can "pack some punch," as did the rally this week off Tuesday's Triple Breakout through Triple Validated Resistance. From Monday's Triple Top/Ascending Triangle low to yesterday's high, FCX has rallied 12.7% in just four days' time.

Here's the result of those breakouts that we've got, so far:

Pattern #1: Head & Shoulders Top. Target: 48.97 MADE.

Pattern #2: Triple Top/Ascending Triangle. Target: 49.60 MADE.

Pattern #3: Bull Flag/Channel. Targets: 51.07 and 53.24 both MADE.

Pattern #4: Symmetrical Triangle. Target: 52.19 MADE.

With those four pattern targets all MADE, the easy part of the rally is completed. As always, it's a good idea to "take profits, or at least 'some' profits, when targets get MADE." In this case, a total of six targets have been MADE, including the first Falling Wedge target, listed below.

Pattern #5: Falling Wedge. Target: 52.70 MADE. Targets: 56.49 (the high at Black #3) and 58.75 (the high of the pattern) still are IN PLAY.

I've never found anything in technical analysis that is reliable as far as measuring a target for Rising and Falling Wedges. I find them to be the least reliable of the patterns when they break out or break down. In the case of this particular Falling Wedge breakout, most of the candles in the chart when the pattern broke out at 49.188 were traded at prices higher than that breakout number, so all the candles that are higher, preceding the breakout, represent a fairly immediate overhang of sellers who paid a higher price and who would like to sell the stock at a break even. That same problem contributed to the selloff from the May 31 high of 52.70 to the June 16 low of 47.06, so we want to be mindful of that.

Much depends on the amount of resistance there is, prior to the breakout. In this case, we've got a fair amount. Much also depends on how good the breakout is. In this case, a Triple Breakout through Triple Validated Resistance is a strong breakout, as we've witnessed this week, so that's certainly a positive.

As far as a Falling Wedge target is concerned, the general idea is "a rally back toward the high of the pattern." We just looked at an excellent example of that in yesterday's chart of AMZN, which rallied to within pennies of the top of its Falling Wedge, but AMZN also didn't have the kind of overhead resistance that FCX has. So, you see what I mean about "it depends" on a number of factors.

We also can take the high minus the low of the Falling Wedge pattern, then add that to the 49.118 breakout point. That's a perfectly valid way to establish a target, but it might be a bit ambitious, given the amount of resistance in the stock. That's something farther down the road, if FCX continues to act bullish, so we won't get ahead of ourselves. Just be aware that between here and the top of the Falling Wedge, The Bulls have some resistance with which to contend, and there's a larger Falling Wedge seen in this Ichimoku Kinko Hyo chart, which goes back to January.


We can "See at a glance...the table of balance" that the last two rally attempts ended with FCX banging its head on the bottom of Kumo (Cloud) resistance, on May 3 and on May 31. Yesterday's close above the Kumo (Cloud) was the first close in Bullish Territory in two months' time. That doesn't guarantee anything about the future, but it's a score for The Bulls. Actually, it's six scores for The Bulls since six targets got MADE in the process. LOL.

On a pullback here, the Kumo (Cloud) "should" act as support. Specific support levels:

1. 50.38 - 50.46 - The recent highs and the gap from June 28.
2. 49.62 - 49.90 - The bottom of the Kumo (Cloud) and former Double and Triple validated resistance


Looking at the one year chart, we also can "See at a glance..." that the first half of 2011 has been a consolidation of the extraordinary gain that FCX enjoyed during the last half of 2010. Other than the Head & Shoulders Top pattern, which resolved to the upside, there was no consolidation of that 116% gain to speak of. From that perspective, this lengthy period of consolidation certainly isn't unwarranted and, structurally, it's very healthy. Stocks that go straight up, parabolically, without any consolidation, are in danger of "Ye Olde Parabolic Rally...And Parabolic Return" to the origin of the rally, or somewhere near there. Here's a rather ugly illustration of that:


YEESH.

By comparison, the last six months' consolidation in FCX doesn't seem so bad now, does it? ;)

Have a great 4th of July weekend, everyone!

Thursday, June 30, 2011

AMZN: The Hook At Triple Support


What a stunning (and deceptive) move in AMZN off the 181.59 (1) validation of support at the bottom of the Falling Wedge; (2) bottom of the Kumo (Cloud); and, (3) support near the neckline of the Bullish Inverse H&S pattern.

The June 16 close was just a hair below the neckline for a one-day "knuckle-biter" for The Bulls (leaving them wondering if the stock was going to tank), then ... LIFT OFF! The stock has made it all the way back to the top of the Falling Wedge, so that target has been MADE.

AMZN is a stock, among others, that the shorts love to hate, usually based on some opinion that they have of value. "This stock is a piece of junk." "This thing isn't worth yap ... yap ... yap ..."

There's a time to short ALL stocks, and there's nothing wrong with that, but we need to be very careful about getting stuck in some opinion of value. Expressing it during cocktail hour conversation is harmless and can be quite entertaining. Expressing our opinion of value by shorting a stock that is acting bullish, or by being long a stock that is acting bearish, can be deadly if we do it very often.

That June 16 low is a fine example of what many technicians call "a hook" in the trade. It "looks like" a failure, catching the majority of players "wrong-footed," then it rips to the upside.

The January 18 Bearish Wolfe Wave 5 "Fakeout/Breakout" to the upside is another example of "a hook" in the trade. The Bears "buy to cover" the upside technical breakout and The Bulls buy the technical breakout. The proverbial "everyone" is caught "wrong-footed," buying at exactly the wrong time, at a high in the stock. UGH.

What makes those "hooks" so difficult is that we get caught in our mindset, like at the June 16 low in AMZN, thinking, "This looks HORRIBLE." If we can clear our minds, watch what IS HAPPENING, and act on those "hooks," it can be very profitable.

I won't whine again that "they" didn't fill my order for 1,000 shares on June 16, at 181.75, because I should slap myself silly for not "paying up" when I saw AMZN rallying off that 181.59 "hook" at TRIPLE support: (1) bottom of the Falling Wedge; (2) bottom of the cloud; and, (3) Inverse H&S neckline.

How much evidence do you want?

Ouch! Ouch! Ouch! Stop that, Melf! OUCH! OUCH! OUCH!

Wednesday, June 29, 2011

Triple Breakout Through Triple Validated Resistance


This Triple Top/Ascending Triangle breakout on Monday was what launched the current rally. Notice that after the breakout, 48.50, the lowest of the three tops, became support.

"After a breakout, former resistance 'should be' support on a selloff." It was.


The Triple Top/Ascending Triangle breakout on Monday was followed up with a TRIPLE breakout above TRIPLE validated resistance, similar in effect to the Ascending Triangle breakout of May 25, above QUINTUPLE validated resistance (five red arrows). FCX rallied, the Ascending Triangle target of 52,28 got MADE, then the stock validated resistance at the top of the Falling Wedge after five consecutive, unsustainable gaps higher.

Both rallies were/are driven by "buying begets buying." Shorts are squeezed on the breakouts (in this case four breakouts) as the trade moves against them and longs step in and buy. As an example of that, I mentioned at the FCX Board yesterday that the shorts would get some respite if FCX traded back below 49.65, the top of the Triple Validated resistance, after the Triple Breakout. They only got two minutes of respite when the stock traded down to 49.61, then the pressure to buy was on again into the close, and into early today when the Bull Flag target of 51.07 and the Symmetrical Triangle target of 52.19 both got MADE.

"Don't be caught short an upside technical breakout." Especially not short four pattern breakouts, above Triple Validated Resistance. UGH.


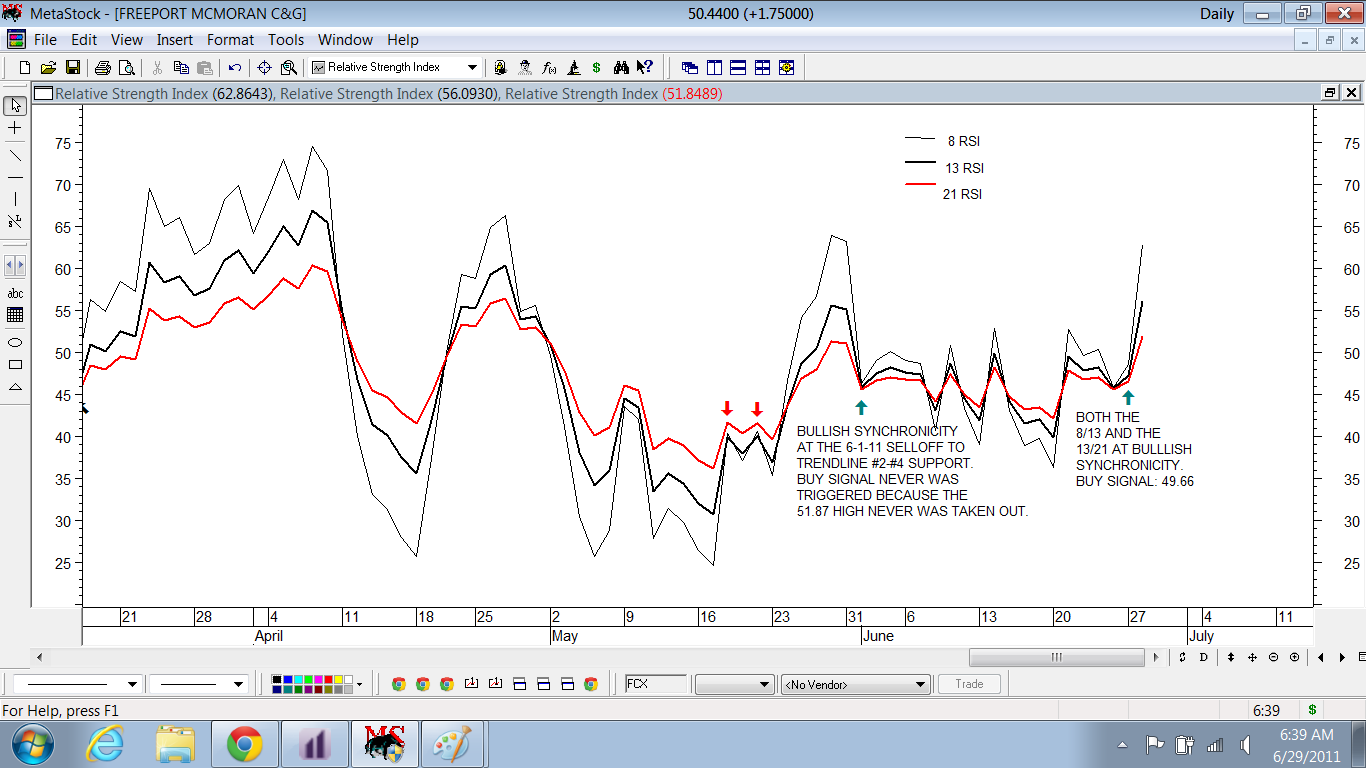
Both the 8/13 and the 13/21 Fibonacci Sequential Measures of Relative Strength gave their first buy signals in many moons, on yesterday's Triple Breakout and print of 49.66, above Triple Validated Resistance. Signals like that in conjunction with breakouts tend to be very supportive of a rally, ala, "We're ready for liftoff, Houston!"


Basis the Ichimoku Kinko Hyo chart, FCX closed yesterday at the "bottom rung" of Kumo (Cloud) resistance, which was from 50.25 up to 52.405. Today's rally got above the Kumo, to 52.62, then pulled back. The May 31 high was 52.70, where FCX failed at the bottom of the Kumo. The May 10 rally high of 52.30 also failed at Kumo (Cloud) resistance. Today's move to 52.62 is the first print above the Kumo in nearly two month's time.

FCX: Triple Breakout

From yesterday morning:

"48.54 + 0.43 = Target: 48.97 IN PLAY

48.50 + 1.10 = Target: 49.60 IN PLAY

The key numbers that The Bulls need to take out continue to be:

1. 49.65 - The Triple Validated Resistance High
2. 49.90 - The Double Validated Resistance High
3. 50.38 - The High at Blue #4 in the Bull Flag/Channel"

Both targets got MADE in yesterday's session, and The Bulls also got through those three important levels of resistance.

I keep getting "error" when I try to upload my charts this morning. I'll try it again later on.

The bad tick down to the 45's on Monday caused me to miss the third pattern in the daily chart, a Symmetrical Triangle, which also broke out yesterday. That pattern is comprised of the last four candles in the daily chart, prior to yesterday's TRIPLE breakout. It would best be seen on an intraday chart, like Tuesday's Triple Top/Ascending Triangle breakout, but unfortunately, we had the bad tick so it can't be seen other than in the daily chart.

For the Symmetrical Triangle:

Data Point #1: 49.90 high on 6-22
Data Point #2: 47.11 low on 6-23
Data Point #3: 49.65 high on 6-24
Data Point #4: 47.40 low on 6-27

No need to post the target since everyone knows how to do that after the dozens of target calculations that I've posted, right? RIGHT??? LOL.

Hint: Take the high of the pattern minus the low of the pattern, then add that amount to where the trendline was when the pattern broke out.

The Triple Breakout:

1. FALLING WEDGE - crossing the trendline above 49.188
2. BULL FLAG/CHANNEL - crossing the trendline above 49.23
3. SYMMETRICAL TRIANGLE - crossing the trendline above 49.40 (<<< hint)