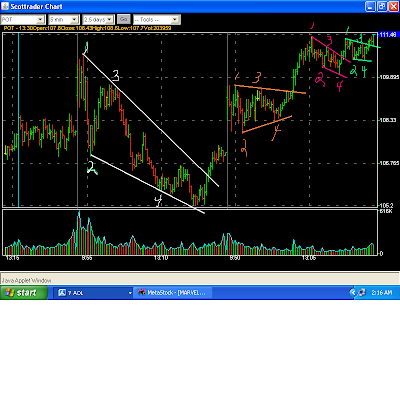
POT finished last week by finding support at the 105.44-105.49 top of the Ascending Triangle (horizontal red line), and breaking out of a Bullish Falling Wedge (pattern in white), continuing its bullish behavior since the May 1-4 TRIPLE Breakout in the daily chart.
Yesterday morning, POT gapped up about two dollars, to 109.17, and rallied a bit more toward 19.63 (the higher horizontal blue line), which was the secondary high in the Bullish Falling Wedge, prior to the selloff to 105.20 on Friday.
I generally won't short a stock that is acting this bullish, but opening gaps like that often have a 50% or 61.8% retracement, and sometimes fill the gap completely. POT also had some nearby resistance inside the Bullish Falling Wedge, between the 109.63 secondary high and the 110.75 high of The Wedge, so I shorted it at 109.45, playing it for only a 50% retracement of the gap, which was 108.295.
I used the 107.42 "last high" before Friday's close for my calculation, to be conservative, but it would be fine to use Friday's actual close of 107.14.
109.17 - Opening Price
107.42 - The "last high" before the close on Friday
109.17 - 107.42 = 1.75 points
50% Retracement of the opening gap = 108.295
61.8% Retracement of the opening gap = 108.09
I covered my short when the 50% retracement target of 108.295 got MADE. The low on the session turned out to be 107.83, which was pretty close to a .618 retracement of the entire gap, between the 109.17 open and Friday's 107.14 close: 107.915.
Given how bullish POT has been acting, my next move was to get long, at 108.85, during the formation of this Symmetrical Triangle:

Notice that as price coiled toward the apex of the Symmetrical Triangle, there were two refusals (white arrows) at the top of the pattern. "Not yet." "Not yet."
During that time, price remained near the top of the Symmetrical Triangle, and another little Symmetrical Triangle (in yellow) formed, "nested" within the larger pattern. Then...KABOOM!!!
Notice the nice volume that came in on the breakout. The proverbial "everyone" is a buyer. Shorts must Buy To Cover in order to get out of the way of a rally out of DOUBLE breakout (the little "nested" triangle within the larget one), which also is a breakout above TWICE validated resistance (the two white arrows), and longs Buy The Breakout. Ms. Market has spoken pretty clearly, and "Buying begets buying."
After the breakout, I moved my mental stop under 109.01, the "last low" prior to the breakout.
110.75, which was the high of Friday's Bullish Falling Wedge, already was IN PLAY. The breakout of this Symmetrical Triangle put a target of 111.17 IN PLAY.
Math:
109.60 - High of the pattern (also the morning high)
107.83 - Low of the pattern (also the morning low)
109.60 - 107.83 = 1.77 points of upside on the breakout above 109.40, which is where the upper treandline was when the pattern broke out.
109.40 + 1.77 = Target: 111.17 IN PLAY

After the breakout, POT rallied to 110.20, pulled back, then took out that 110.20 high. I moved my mental stop up (horizontal red line), but had no problem on the trade. It took only about seventeen minutes for the 110.75 target to get MADE, where I sold half my position, and about another half hour for the 111.17 target to get MADE, where I sold the other half of my position.

Since Friday's late day Bullish Falling Wedge (pattern in white) breakout, POT has formed and broken out of FOUR bullish intraday patterns. Quite nice.

Gain on the two trades: A bit over $3,200.
You can see why I say that I'm lousy at predicting anything, and why I say that I just try to FOLLOW Ms. Market, as best I can. Given how bullish POT has been acting, I sure didn't think at the weekend that I'd end up SHORTING this stock yesterday morning, but there you have it. I also didn't know that it was going to gap up two dollars.
As I've said many times, we can't possibly know what a stock (or index) is going to do, but we CAN know what we're going to do about it."

2 comments:
Melf,
Lovely trades on POT. Do you anticipate patterns and formations while you are reviewing charts? Is there a if this then that aspect to your analysis so you can be prepared for the trade when it appears? I guess what I'm asking is how you prepare for anticipated trades.
Good Morning, Mark,
Thanks. Yes, I try to anticipate pattern breakouts, which is why I often mention "Data Point #4." That completes the establishment of two highs and two lows. If it looks good, I often will take a position in anticipation of a breakout.
Yesterday, I knew that we had 10.75 IN PLAY from Friday's Bullish Falling Wedge breakout. That was the top of the pattern. The Symmetrical Triangle that formed after the morning low looked very nice. Once it broke out, I could calculate the 111.17 target that went IN PLAY from the point of the breakout (109.40).
This morning at the open, for example, I was anticipating a pullback to the top of the Bull Flag (the last pattern on the intraday chart), which came in at 110.85 at the open. POT pulled back to a low of 110.82, then took off like a rocket. It currently is trading over $114 in a down market. Whew!
Post a Comment