Wednesday, October 31, 2007

SILC: Trick....or Treat?


Annie,
After the September 4 Breakaway Gap, the first target of 26.74, which was a return to the high of the Big Symmetrical Triangle (in black) got MADE very quickly, and was exceeded, confirming the breakout was, indeed, bullish.
"Take at least 'some' profits when targets get MADE."
On September 20 SILC nailed a successful retest of the Symmetrical Triangle on a Bullish Hammer candle. Retests of breakouts are to be expected, especially after any target gets MADE, and at that point, SILC was looking like a champ, and there was every reason to think that the next target of 32.79 also would get MADE. Until....
As you will remember, stocks often trade in "fractals," or "patterns that repeat," like XING in January, 2007. The Symmetrical Triangle in blue in this chart is a much smaller version "or, fractal" of the one in black. Symmetrical Triangle patterns are "continuation patterns," so we expect them to breakout and continue in the direction of the trend, as SILC did on the September 4 Breakway Gap. The chart was VERY bullish, and the breakout was to the upside.
But, be careful when "continuation patterns" DON'T breakout in the direction of the trend and go the other way, because that's a strong sign of a reversal in the trend. SILC broke down out of the Symmetrical Triangle (in blue), and when that occurred on October 22, the stock not only came under some selling pressure, it went into serious technical failure.
I haven't heard of this stock until you asked about it this morning, so I don't know "the reason" for the October 22 smackdown, but as you know, I always say look at the stock's REACTION to earnings, analysts' upgrades and downgrades, news releases, etc.
I'll guess that SILC released earnings that "disappointed" because it has enjoyed a spectacular gain of 600%+ in just over a year, so a case of "Buy the rumor...Sell the news."
But, whatever "the reason " for the selloff was if you know of one, this also was going on, technically:
1. The Symmetrical Triangle "fractal' (in blue) broke to the downside, and it "shouldn't have." It "should have" resolved in the direction of the trend, and by breaking DOWN, it was giving a strong indication of a trend reversal.
2. That breakdown put a target of 17.28 IN PLAY.
Math: Subtract the low of the pattern from the high (6.01 points), then subtract that answer from the data point along the lower trendline (23.29) to derive your target.
3. Remember the successful retest of the top of the Symmetrical Triangle, at 22.23, on September 20? That also got broken to the downside, and it "shouldn't have." The work of establishing technical support there already was completed, and when it WASN'T support any longer, on October 22, that brought in more "technical selling" from the players who were using it as their "stop loss."
4. After that broke, next support was another retest of the top of the Symmetrical Triangle, which came in on October 22 at about 21.68. When players saw THAT wasn't support either, and that SILC was going back inside the BIG Symmetrical Triangle, many of them threw in. And, as SILC went farther down into the Symmetrical Triangle, more selling. UGH. The 17.28 target IN PLAY nearly got MADE in one day!
October 23, the bottom of the Big Symmetrical triangle came in at 17.24, and SILC nailed that trendline EXACTLY. The low on the day was 17.24, and SILC finished the day on a Bullish Hammer, giving longs a chance to breathe a sigh of relief!
When a stock retests a trendline and holds it, that's called a "trendline validation." The market is telling us, "Yes, that IS support." Many technical players will put in their orders to buy right there, or a penny or three above it.
A validated trendline becomes important because, if later on the market tells us, "That no longer is support," that's an "uh-oh..." How much of an "uh-oh" depends a lot on the length of time that trendline has existed. In this case it has existed since June, and it's part of a pattern that has existed since April. If it gets broken to the downside, everyone who is holding long ABOVE that trendline is holding the stock at a loss, and in this case, it's of 7-months' duration.
October 29, SILC violated the "validated trendline" on an intraday basis, but closed the session out back above the trendline, on a "hopeful-looking" Bullish Hammer.
"Bear markets descend on a cushion of hope." At yesterday's close, SILC broke below the BIG Symmetrical Triangle, puttting a downside target of 7.54 IN PLAY (the height of the pattern, subtracted from the point of the breakdow).
As we know, targets don't always get MADE. They only are what the measurement of the pattern added to or subtracted from the breakout or breakdown suggest. But, we also know that 7-months worth of longs who purchased the stock and who haven't sold, now are trapped above the trendline with a loss, and that they now represent "overhead resistance."
The October 30 breakdown "could be" a Bear Trap, and if it is SILC "should" get back above that broken trendline VERY quickly, because players who hold the stock and who allow for that possiblity will become weak-kneed if they see much more downside in the stock.
Best of luck to you with this one, Annie!

Tuesday, October 30, 2007

XING: Responses To Dutton's Calls


(Click On Chart To Enlarge)
Dutton upgraded of XING on January 16, 2007. The market's response was to break the stock out of a QUADRUPLE nested bullish pattern, and send it on its way to both the FOUR technical targets that were IN PLAY, as well as to Dutton's 20.23 target. On the first chart, January 16 is the big white candle. That upgrade was during trading, and XING soared immediately when the upgrade came out.
Dutton reiterated their Strong Buy on February 14. XING closed at 18.20. The market's response was to rally the stock for only six more days, to the 2007 top of 19.94, just below Dutton's 20.23 target.
Dutton not only wasted a bullet on that call since XING was doing fine in the rally that already was in progress from their first call, investors who bought XING at 18.20 on the recommendation can't be very happy knowing that they bought it about six days before THE TOP, for 2007. OUCH!!
Dutton reiterated their Strong Buy on June 4 after XING broke down out of the Bearish Rising Wedge, and MADE both targets that were IN PLAY: 14.52 and 12.77. XING, on June 4, was at 12.43 (the candle at the far left on the second chart).
Dutton lost a tremendous amount of credibility right there, with that June 4 call. Investors who bought XING at 18.20 on February 14 have to be thinking, "WHAT?? It sure wasn't a Strong Buy when I bought it at 18.20! XING is down 31% from there, and now you're going to reiterate your Strong Buy?"
Dutton reiterated the Strong Buy again on August 21, with XING closing at 9.74, down 46.5% from their February 14 reiteration, and down 27.6% from their June 4 reiteration. Now, what are investors who bought those two Strong Buy reiterations saying?
$##$%$%
And, when XING finally hit bottom at 7.65 on September 14, 2007
The February 14 investors are down 58%
The June 4 investors are down 38.5%
The August 21 investors are down 21.5%
How credible were Dutton's Strong Buy reiterations with any of those investors? XING has recovered, as we know, but we certainly can't give attribution for that to Dutton. XING stumbled badly after their last Strong Buy reiteration, and didn't begin to rally until 3 weeks after their call.
The ONLY thing about the fundamentals that is important to me, is the market's RESPONSE to them. Earnings. Upgrades and Downgrades. News items.
Will Dutton's "Speculative" Strong Buy reiteration of October 29 at least get XING rallying back to 11.50 resistance, which is the bottom of the 11.50-11.97 "neutral zone?" Will the reiteration help XING get back inside that neutral zone? Will it help XING get back above 12.00?
That's what I'll be watching for . The market's RESPONSE to the reiteration.
And, by the way, with XING at something like a P/E of 5 basis 2008 earnings, my read on the "Speculative" insertion to the Strong Buy reiteration is that there is "risk/speculation" that XING could be a "value trap" at this ridiculously low P/E, meaning that if XING management can't get their act together and the stock tanks as a result, investors are "trapped" because they bought the stock, thinking that it was a "value" play.
XING already has been a "value trap" for investors who bought it at much higher prices, in the 10-month Head & Shoulders Top.

Sunday, October 28, 2007

TIE: Inverse Head & Shoulders Breakout


(Click On Chart To Enlarge)

Friday's Inverse H&S breakout was on a Breakaway Gap, and on heavy volume: 14 million shares. A target of 44.17 is IN PLAY. Target date: by January 25, 2008, but no later than March 25, 2008.

Saturday, October 27, 2007

VPHM: Ahead Of Earnings


(Click On Charts To Enlarge)


My pre-market comment, on the Yahoo XING Message Board, after XING released earnings Friday morning:


26-Oct-07 09:04 am


"I'm very glad to see these good earnings finally come out. Today, it's important to see how the market REACTS to the good earnings, i.e., we don't want to see any "Gap To Crap," and a slide all the way back to UNCH, like we did on the October 11 rally."


Result: XING had a horrible "Gap To Crap" opening at 10-month H&S Top neckline resistance, got to 13.00, then slid for remainder of the day, closing at 11.27, down 13.3% off the early morning "Gap To Crap" high. UGH...


Going into this week's earnings, VPHM is positioned similarly to how XING was, technically.


In the first chart, we can see that the dominant feature is the 5 1/2 month wedge (in purple), out of which VPHM crashed in July. During the 2 1/2 month Crash Recovery process, VPHM has formed a weak Symmetrical Triangle pattern (in blue).


It's weak because:


1. The chart is bearish, and Symmetrical Triangles "usually" are continuation patterns that get resolved in the direction of the trend, unless it's a reversal pattern.


Well, there's the rub! We don't know that yet because the pattern hasn't been resolved. If patterns were ALWAYS bearish or bullish, the stock market would be a "no brainer," and we know that it isn't. So, we have to watch this pattern and see, but be mindful of the fact that the trend is DOWN, and that any rally is a rally into RESISTANCE.


2. TWICE, VPHM has validated the bottom of the pattern (in blue), but also TWICE, VPHM has violated the lower trendline on an intraday basis, showing weakness.


3. It's a 2 1/2-month pattern that is "possibly" bullish, but it's going up against a 5-month pattern that we know was bearish. "Ye old supply and demand." VPHM, if it breaks out to the upside, has to rally into that 5-months' worth of overhead supply. Longs are trapped in the Wedge (purple), and many of them WANT OUT on the next rally. Not all of them, of course, and some of them already got out in The Crash, or since then, but a lot of them will want to sell any decent rally that gets them out whole, or at a more acceptable loss.


With that in mind, if VPHM can come out with good earnings, and is indicated higher in pre-market, what would we look for?


Naturally, we'd want to get a quick idea of "how good" the earnings are. Did they absolutely blow away numbers, and give very good forward guidance, etc.? If they did, and VPHM has some OUTSTANDING pre-market indication, like BID: 14.50...ASK 14.55, that would be near Purple #5 in the first chart, well into resistance, and players trapped in the wedge might be less inclined to sell, and might be willing to hold longer-term, if the market REACTION to earnings is good. "Some selling" of a gap opening would be normal working through of the resistance, but we wouldn't want to see what I described Friday morning in XING as a slow-w-w blood-letting, steady decline in the stock. UGH...


Looking at the second chart, if VPHM "just beats," .... nothing great, but is indicated higher, I'd immediately be suspicious of a "Gap To Crap" opening that might fail, because of the overhead resistance. If those trapped in the Wedge see VPHM start to slide immediately from the open, many of them likely will get panicky, and want out. Shorts who covered ahead of earnings will be invited back in, especially if it's a "Gap To Crap" to some resistance level that they're watching. Short-term players who buy the opening "Gap To Crap" quickly will realize that they've bought a pig in a poke, and will panic out of it, as well.


Levels to watch for a possible "Gap To Crap" opening:


11.18 (as of today...could change by earnings): That's the top of the Kumo (cloud) basis the Ichimoku Kinko Hyo chart. VPHM failed there exactly, at 14.85, on August 2 on the Bull Trap upside fakeout (see first chart).


11.644 - If we create a parallel line with a slope of 0.03125, identical to the slope of the bottom of the Symmetrical Triangle, it will come in on November 2 right there. A failure at, or near there, would give a strong suggestion that the Symmetrical Triangle has "morphed" (changed) into a Rising Channel, and those also "tend to be" bearish. Not ALWAYS. There were two of those in GIGM recently. BOTH resolved to the upside. Watch for signs of failure there, though.


12.20-12.25 - The extended Wedge trendlines


12.45 - Was the Bear Trap fakeout low, prior to the CRASH. That's the beginning of Wedge resistance, in terms of price.
Message To Oliver (laonda): If you happen to read this, I'd greatly appreciate it if you would link my blog to the Yahoo VPHM Board. I've been getting that danged "Error Message #999" since yesterday morning, and have been unable to post this in case anyone wants to look at it ahead of earnings. Thanks in advance, and best of luck to you if you're in VPHM!


Thursday, October 25, 2007

XING: Put It In Neutral


(Click On Chart To Enlarge)

11.50-11.53 is the bottom of resistance, where XING failed on Tuesday.

11.94-11.95 is resistance from the XING's failure to hold the Cup & Handle Breakout

11.97 is resistance from the failure at the top of the Hourly Descending Triangle.


This morning, they opened XING on 100 shares at 11.94, near the very top of resistance, immediately dropped it to 11.67 on 6,904 shares, then dropped it to fairly quickly to 11.52, the very bottom of the of the resistance range.


As manipulated as that open looks (and it could be), there's something very different about this morning's open vs. the other three opens this week:


Those three opens resulted in FAILURES AT OR BELOW RESISTANCE.

This morning's open resulted in a REESTABLISHMENT OF 11.50-11.53 AS SUPPORT.


If the only thing that XING manages to accomplish in today's session is to hang onto to that 11.50-11.53 support, that will be a constructive session. XING then will be short-term neutral instead of bearish, and it will be "poised to go higher" on the release of earnings if they come out soon.

Anything better than that today, an upside takeout of 11.94-11.97 resistance, obviously would be very good.

Wednesday, October 24, 2007

XING: Failed Countertrend Rally


(Click On Chart To Enlarge)


After last week's failures in the Hourly, Daily and Weekly charts, XING found its footing at the 10.56 gap, putting in a low of 10.54.


After the last breakdown of the Descending Triangle (in white), at 11.50, we want to examine the quality of the next rally, to determine if it's just a countertrend rally (a rally in a bearish trend), or if it's something more than that.


After the breakdown (at 11.50), "Former support 'should be' resistance." It was, exactly at 11.50 yesterday.


Coming off the 10.54 low, we label that with Yellow #1, to see if a pattern emergees. At the first high before a pullback, we put Yellow #2 (that was in the 11.40s). At the next low, Yellow #3, and at the next high (11.50), we put Yellow #4.


We can see now that we've got a Bearish Rising Wedge. Those aren't ALWAYS bearish (nothing is). We look for confirmation that it actually IS bearish:


Confirmation #1: Failure at "former support of 11.50, was resistance." We got that yesterday.


Confirmation #2: A break of the trendline connecting Yellow #1 and Yellow #3. We got that this morning.


Confirmation #3: A "lower low" than yesterday's 10.94 low. We got that this morning, with today's 10.83 low.


Technically, XING is a very weak puppy, given those confirmations, at this point, that the rally off 10.54 to 11.50 was nothing more than a bearish countertrend rally. What would refute that, would be for XING to get above 11.50, and hold there.


Fundamentally, XING sure could use the release of a great earnings report, which obviously could trump the poor technicals with a gap above all of the resistance, now between 11.00-11.97.

QXM: Still A "Perfect 10"


(Click On Chart To Enlarge)


From Yahoo's XING Message Board - October 22, 2007


"Apologies, I was hurrying to calculate that neckline, and used a slope of 0.005 instead of the correct slope of 0.0005, so the neckline comes in today at 10.744."


QXM violated that neckline on both an intraday basis and a closing basis, so there went QXM's "Perfect 10" rating, or so I thought. LOL.


In yesterday's session, QXM opened at 10.97, raced to 11.80, came back and planted a foot at 10.75, NAILING the successful retest exactly (within less than a penny), then soared 15% higher, to 12.36, and closed at 12.34.


Monday's trading below the neckline obviously was a BEAR TRAP, and just because I'm a little bit sore that I "got played" by that fakeout, it would be very unfair of me to give QXM any deductions when it did such an excellent job of setting that Bear Trap, and then immediately exposing the deception yesterday with the "bang on" successful retest of the neckline of the Bullish Inverse H&S pattern.


As much as I hate those danged Bear Traps (and Bull Traps)...CURSES!...


Scores for Technical Merit:


10...10...10...10...10...10...10

Tuesday, October 23, 2007

XING: Bullish Falling Wedge


(Click On Chart To Enlarge)


My apologies for the fact that this chart looks like I threw a pizza pie at it, but we've got a lot going on in it. LOL.


Back in January, the chart was similar in the respect that we had "nested patterns" (patterns within patterns) and pattern "morphing" (patterns changing into something else) and two pattern "fractals" (patterns that repeat).


I can see why people give up on technical analysis and call it useless and such things, because it can become frustrating watching the patterns develop, and trying to figure it all out. And, sometimes we don't figure it out at all, either through some lacking on the part of the technician who is interpreting the chart, or because there simply isn't a pattern to discern.


If you have the time and the interest, scroll down to my October 10 post "XING: January Rally." Those who remember my posts back in January (Voova...Oliver...Thai) will recall all of the head scratching that we did during the pattern development and the pattern "morphing," but a few days after we bought XING, we got our anticipated breakout on January 16 on the Dutton upgrade, and oh buddy!...that rally out of our QUADRUPLE nested bullish pattern was an absolute thing of beauty. All four of our targets got MADE, the last one at 19.06, not far from the eventual high.


"Take Profits When Targets Get MADE."


Currently, XING is "on the ropes," after all of technical damage done the charts last week. We had FOUR upside targets that got MADE, and yesterday, we had our first downside target of 10.77 get MADE, and although there wasn't a pattern measurement to give us a target of 10.41-10.56 (the October 8 gap), that definitely was IN PLAY after Friday's breakdown of the Descending Triangle, and that also got MADE (yesterday's low was 10.54). While that wasn't very pleasant, it's out of the way, and XING now has a chance to resume acting bullish.


Yesterday's 11.45 open is questionable (there didn't appear to be any trades there), but here's why that doesn't matter too much:


1. Look at the Descending Triangle pattern (in blue...#1 through #4) that we discussed all last week. The lows of that pattern were 11.51...11.53...11.50...11.50...and when that support got taken out, XING went down very quickly to an immediate gap fill of 11.17, a minimum expectation. Then yesterday, our 10.77 measured move target got MADE.


Math:


12.29 - High of the Descending Triangle

11.53 - The most consevative of the 11.53-11.50 lows, so that we don't overestimate)


12.29 - 11.53 = 0.76 points. 11.53 - 0.76 = Target: 10.77 IN PLAY.


If anyone wants to use the actual low of 11.50 to measure, that's perfectly fine. That target would be 10.71, and that also MADE. I like to be conservative.


2. Patterns often "morph" (change into something else), and they also often are "nested" a pattern within a pattern.


Look at the pattern in BLACK. That's a "possible" Bullish Falling Wedge, and the Descending Triangle (in blue) is "nested" within it. 12.29 is the high...yesterday's 10.54 is the low.


The reason that yesterday's possibly erroneous 11.45 open isn't going to matter much, is because we need to take out the top of the Bullish Falling Wedge any way (that's the trendline connecting Black #1 and Black #3), and that data point for today, October 23, comes in at 11.4987, so a print today of 11.50 is a technical breakout of the "possible" Bullish Falling Wedge.


Did you say 11.50?


Yep.


Umm-mm, wasn't that last week's support, and doesn't "former support become resistance?"


Yep.


That's a problem that XING has been having lately. The 11.95-11.94 Cup & Handle breakout was a breakout into IMMEDIATE resistance, beginning at 12.08, which was The Rectangle pattern low, prior to the smackdown.


A breakout today at 11.50 also is a breakout into IMMEDIATE resistance. It would be a start in the right direction, but it might result in a lot of head banging with those players trapped inside the Descending Triangle (11.50 all the way up to 12.29, the high of both the Descending Triangle and this "possible" Bullish Falling Wedge).


I bought the last Bullish Falling Wedge breakout (the pattern in purple) because we had some head room between there and 11.95-11.94 resistance, but I'll have to pass on this one if we get the print of 11.50 because I don't like buying into IMMEDIATE resistance.
Key Numbers:
11.95-11.94 - The highs of the Cup & Handle
11.97 - last week's Descending Triangle breakout failure high.
If those can get taken out to the upside, with prices remaining above them, that would look much better.

Sorry that this was so lengthy, if anyone got this far, but when I was learning technical analysis, I needed a lot of explanations, so maybe someone else needs that, too :)


Good luck, everyone!


Sunday, October 21, 2007

XING: Technical Difficulties


(Click On The Charts To Enlarge)


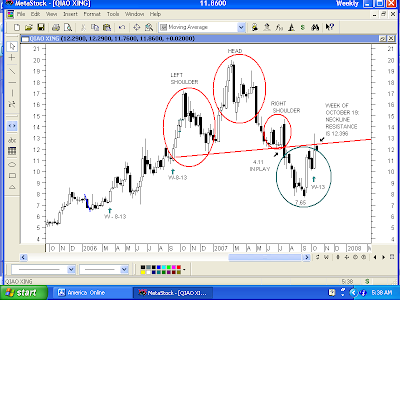
The Weekly Chart gives us the best visual illustration of the technical difficulty that XING had this week. The neckline of the Head & Shoulders Top was broken on July 17, on a gap down from 13.97 to 11.28, on the news that XING would have to restate financial data for 2003-2005.


On any rally, "former support should be resistance," and much of that depends upon how large the pattern was, and upon how much time the stock has spent forming a new base, prior to an attempt to get back above the resistance.


In the case of XING, the top was of 10 months duration; the base prior to attacking the neckline was only about two and half months, so "former support was resistance" on this week's "Gap To Crap" opening, at 12,29.


The Daily Chart turned short-term bullish on September 20, when XING printed 9.99, taking out the middle of the "W" bottom. From there, the stock continued to "act bullish," and all of the bullish targets got MADE.


Since the reversal from 13.38, XING has been between the proverbial rock and a hard place. It couldn't close back above the 11.95-11.94 Cup & Handle breakout (former resistance should have been support, but it wasn't), nor could it break below 10.53-10.50 short-term support.


On Friday, that short-term issue got resolved in favor of the bears, with the following information:


1. XING needed to break above 11.97 for a "higher high" coming out of the Descending Triangle. Friday's high was 11.969 in early trading, then the selloff began.


2. 11.95-11.94 Cup & Handle support, again, was no support at all.


3. XING reversed back into the Descending Triangle, confirming the breakout failure.


4. The trendline (red diagonal) coming off the 7.65 low was a validated trendline, meaning that it had been tested, and it had held. That trendline came in on Friday at 11.63. It got penetrated slightly in the high 11.50s, XING tried to hang on to it in the low 11.60s and stage a late afternoon rally, but that failed.


5. 11.53-11.50 short-term support fell very quickly thereafter, and XING slid to a gap fill of 11.19, and slightly below it.


6. MACD in the daily chart crossed below its signal line.


So, what have we got?


1. A failure in the weekly chart at the open last Monday (resistance at the neckline)


2. A failure in the daily chart all week (the top of the Cup & Handle breakout wasn't support)


3. A failure in the hourly chart on Friday (the Descending Triangle was a "fakeout breakout" that resolved to the downside).


On any rally early this week, resistance levels are:


11.50 - 11.53 - The bottom of the Descending Triangle


11.80 - The up trendline (red diagonal) off the 7.65 low


11.94-11.95 - The failed Cup & Handle Breakout


11.97 - The top of the Descending Triangle failure


On the downside:


10.77 is IN PLAY from the Descending Triangle failure and breakdown.


Saturday, October 20, 2007

VPHM - Hanging On By A Thread


(Click On Chart To Enlarge)


From the VPHM Yahoo Message Board - October 18, 2007 3:16PM


"....We've got a little resistance here at 9.79-9.80.


If we can get through there, a print tomorrow of 9.89 would be a technical breakout. I took profits on 25% of my position at 9.77 this afternoon, just in case we don't get the breakout. Looks good at this point, though."


I sold the remaining 75% of my VPHM for a little better than break even going into the close on Friday and was glad that I made the "safety play" of selling 25% of the position at resistance on Thursday. Disappointing, but trades don't always work out as well as we would like.


The TWICE VALIDATED bottom rail of the Symmetrical Triangle pattern came in on Friday at 9.07, so it wasn't violated by Friday's 9.09 low. The upward slope of the trendline is 0.03125 per day, so we "move the chains," so to speak, and that trendline will come in on Monday, October 22, at 9.10375. Friday's close was 9.10, so if VPHM opens UNCH, it will be sitting smack on that trendline.


Anything below 9.10 will be a technical violation of a TWICE VALIDATED trendline, which "should" have some significance on the downside if it's anything more than a penny or three in the early going, followed by an upside reversal.


Normally, I try to stay with a trade until I'm stopped out, and I wasn't stopped out on this one, but given the strength of Friday's smackdown in the general market, the fact that VPHM is in Crash Recovery, and the fact that this isn't a particularly strong pattern, I decided that "discretion is the better part of valor," and cashed it in for a very small winning trade (1.8%).

Friday, October 19, 2007

XING: Descending Triangle


(Click On Chart To Enlarge)

If we hadn't had the "Gap To Crap" opening of 12.29 earlier this week, right at neckline resistance basis the weekly chart, and if we weren't back below the 11.95-11.94 Cup & Handle breakout basis the daily chart, I would have gotten back into XING on the Descending Triangle breakout yesterday.


Descending Triangles are viewed by some technicians as always bearish. I've looked at too many charts to be of the opinion that there is any "ALWAYS" in the stock market. LOL. Generally, though, I agree that Descending Triangles "tend to" have a bearish outcome, like Nucor in the second example at chart school, which looks similar to the XING Hourly Chart as far as the number of "hits" to the trendlines:


In XING's Hourly Chart, though, we got an UPSIDE breakout of this very well-defined Descending Triangle. Well-defined, because look at the number of "hits" to both trendlines.


After Data Point #4, we have the parameters of the Descending Triangle established. Descending highs, and two lows that are relatively equal in price. Now we'd like to see some confirmation of those trendlines.
At #5, the market is telling us, "Yes, that's a validation of support."


At #6, "Yes, that's a validation of resistance."


At #7, "Yes, that's ANOTHER validation of support."


Then we got the UPSIDE breakout. The lack of volume is a defect, though. When there's resolution to any pattern, we like to see volume come in, in recognition of the breakout (or breakdown). We didn't get it. That's not fatal, but it is a defect.


For XING to have held the 11.50-ish support all week, in a generally down market, is impressive. If volume had come in on the breakout, I would have bought 11.79, but I passed because the volume was weak, and because of the resistance in the daily and weekly charts.


The Descending Triangle targets IN PLAY are 12.29 and 12.57, as long as the breakout holds. Targets are less likely to get MADE when the breakout is headed into resistance, so we have to keep that in mind, particularly with the "tendency" of Descending Triangles toward bearishness.


I'd like to see at least ONE of the targets get MADE, though :)


Thursday, October 18, 2007

ASPV: Double Inverse H&S & Good News


(Click On Chart To Enlarge)


From October 1 post:


"A measured move target of 24.79 is IN PLAY as long as ASPV trades above the neckline of the pattern. Targets don't always get MADE, and sometimes they are exceeded. They're just what we're "aiming for," based on what the pattern suggests. Fundamentally, this would be a nice juncture for some good news on the stock because, technically, the chart is good to go."


We had a very nice breakout of this pattern and now, fundamentally, the good news is that ASPV has agreed to be bought out at $26, so the 24.79 target will get MADE.
I didn't get a chance to get back into ASPV after I "sold into strength," but I had a nice gain in it, and I'm happy for some folks that I know who own this one.


By Robert DanielLast Update: 3:14 AM ET Oct 18, 2007
TEL AVIV (MarketWatch) -- Aspreva Pharmaceuticals Corp., (ASPV:aspreva pharmaceuticals corp com
ASPV 22.50, +0.10, +0.5%) Victoria, British Columbia, said it agreed to be acquired by Galenica Group for US$26 a share cash, or US$915 million. Galenica, based in Bern, produces and retails pharmaceuticals and provides logistical and information services to the health-care industry. Aspreva shares closed Wednesday at $22.50. The deal price is 16% over that close and 24% over the 30-day average trading price. Aspreva's board has approved the terms and urges holders to accept the deal, the company said in a statement on Thursday. Subject to regulatory and legal clearances, the companies hope to close the deal Jan. 3. Lazard and Lehman Brothers advised Aspreva on the transaction.


Wednesday, October 17, 2007

VPHM: Symmetrical Triangle


(Click On Chart To Enlarge)


From October 13 post:


"The upside breakout number for Monday, October 15, is a print above 9.9254, so 9.93, and we obviously want to see the 9.99 high (Green #4) get taken out. Next objective would be the recent high of 10.30, which is the top of the pattern.


My stop is below Thursday's 8.86 low, so not much risk (excluding a gap down, of course)."


VPHM got a pop yesterday afternoon on an analyst's recommendation on CNBC. We didn't get the breakout of the Symmetrical Triangle, but VPHM has been working its way toward the top of the pattern in a down market this week, so it's showing good relative strength here, coming off the DOUBLE trendline validation at the bottom of the pattern.


The technical breakout for today, October 17, would be a print of 9.90. We'd like to see a breakout soon because "rule of thumb" is that if we get much beyond two-thirds of the way to the apex of the triangle (where the trendlines converge), it becomes less likely that we'll get the upside breakout. The apex is roughly November 14, so we're there now, at the two-thirds mark.


If VPHM looks set to CLOSE below 9.00, that would be a violation of a TWICE validated trendline, and I'll sell it for a 2% loss.
EDIT: The breakout date on the chart should be October 17, not October 15.

Tuesday, October 16, 2007

XING: Battle At Neckline Resistance


(Click On Chart To Enlarge)


"Buy support...Sell Resistance."


XING's "Gap To Crap" opening yesterday, to 12.29, was ten cents below neckline resistance basis the weekly chart, which comes in the week of October 19 at 12.396.


A "Gap To Crap" is when a stock opens at or near its high of the day, which seems bullish, but that higher opening is almost immediately met with selling, and the stock languishes and/or slides for the remainder of the session. When the "Gap To Crap" is at KEY RESISTANCE, as it was in XING yesterday at the neckline of the broken Head & Shoulders, it also invites the short sellers in.


"Sell and/or Sell Short at Resistance." They did. The 12.29 opening was the high on the day, and XING got sold and slid to a close of 11.86, near the low of the session.


XING not only opened right below resistance basis the weekly chart, and failed, it also closed back below the 11.95-11.94 Cup & Handle breakout basis the daily chart for the second day in a row, putting the validity of that breakout in serious doubt.


Technically, XING is vulnerable here and needs to close back above the 11.95-11.94 Cup & Handle breakout in the daily chart, and then scramble back above the 12.396 neckline in the weekly chart.


In the Hourly chart (posted at the end of last week), near-term support still is 11.51-11.53.

Monday, October 15, 2007

ROCM: Descending Triangle


(Click On Chart To Enlarge)

When trying to identify chart patterns, start at a high or a low, and label that #1. In this case, we're starting at the high of 19.98.


At the next low, label that #2.

At the next high, label that #3.

At the next low, label that #4.


Now we can see that we've got a Descending Triangle, and we can study about that at Chart School (link at the bottom). As I said to Doug, "Practice...practice...practice," and it's good to practice with stocks that we are playing because "it's real," and we likely will remember that better than some sample chart.


Okay, once we have the pattern, let's see if we get a breakout, or a breakdown. Descending Triangles "tend" to be bearish (the opposite for Ascending Triangles), but there's no "always" about it. Just be aware of the tendency, and watch it.


After the Descending Triangle finished forming at #4, what happened? RCOM rallied back to the top of the pattern. What happened? It FAILED, right there.


That's called VALIDATED RESISTANCE.


The market said, "Yes, that down trendline that you've drawn is important. That's resistance, alright! Now, if it gets taken out to the upside, that has added importance because the stock will have taken out "validated resistance."


If, however, RCOM breaks down below the bottom of the Decending Triangle pattern, 17.05-17.07 support, that's a pattern breakdown, so it's a sell and/or sell short. No guarantees EVER with any pattern. A breakdown "could be" a Bear Trap, but over time, I find it best to take breakdowns and breakouts seriously, and sell or buy them.


To establish a target for any pattern, take the high minus the low, then subtract your answer from the breakdown or breakout.


19.96 - High

17.07 - (the more consevative of the 17.07 and 17.05 lows)


19.96 - 17.07 = 2.89 points


If RCOM breaks down, 14.18 would be IN PLAY.

If RCOM breaks out above 17.75 (validated resistance at the arrow), 20.64 would be IN PLAY.


Try to learn these patterns at chart school, and then practice...practice...practice identifying patterns, and establishing targets.

Saturday, October 13, 2007

VPHM: In Crash Recovery...Again.

(Click On Chart To Enlarge)

VPHM has crashed twice, in as many years.

The dominant pattern on the chart is the one in blue, the Falling Wedge. It had a downside fakeout (Bear Trap), and then an upside fakeout (Bull Trap) at the release of August earnings. When it broke decisively below the pattern, it crashed in earnest.

VPHM has been forming a Symmetrical Triangle since the August low, which was an Exhaustion Gap. Heavy volume. 10 million share day, which finished on a Bullish Doji Star hammer. We usually don't want to go "knife catching" when a stock is in freefall to the downside, but a BUY of that candlestick near the close would be justifiable, in my view. Stop loss below the low of that session, if we did buy it.

See "Gaps and Gap Analysis" at the bottom of this link, then read about Exhaustion Gaps: http://stockcharts.com/school/doku.php?id=chart_school:chart_analysis

Coming off that low, VPHM has been basing in a Symmetrical Triangle (pattern in green). It's a relatively weak base, in that it's only of two months' duration, but what I VERY much like about it is the fact that there have been TWO successful re-tests of the bottom of the pattern.

We can connect any two data points, and call that a trendline, but we don't know if it's an important trendline until THE MARKET tells us that it is, by testing it, and by finding support like VPHM did at the close on October 1, and the open on October 2.

That's called a TRENDLINE VALIDATION.

We got a second trendline validation at the close on Thursday, October 11, and a move higher off that second validation on Friday, which is why I bought VPHM. As I said, it's not a great pattern, but I like to buy (or short) stocks that act well, technically.

The upside breakout number for Monday, October 15, is a print above 9.9254, so 9.93, and we obviously want to see the 9.99 high (Green #4) get taken out. Next objective would be the recent high of 10.30, which is the top of the pattern.

My stop is below Thursday's 8.86 low, so not much risk (excluding a gap down, of course).

TZOO: Technical Analysis 101 (Part 3)

(Click On Chart To Enlarge)

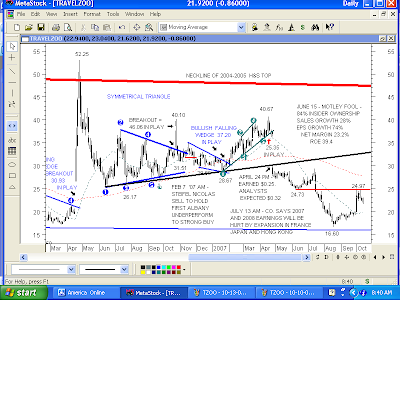
In the year and a half since the "Mother of All Short Squeezes," rally to $52, we can see several patterns that emerged, where they broke out or broke down, what targets were IN PLAY as a result, etc.


Most recently:


Bearish Rising Wedge (Pattern in Green)


That pattern broke down three days before the wicked gap down at the reporting of April earnings, putting 25.35 IN PLAY.


The Black Trendline


At the reporting of April earnings, they gapped TZOO down right below that trendline. We all hate to sell into a terrible plunge like that, but far more often than not, it's the right play when important support like that is broken. TZOO hasn't seen the $30 high of that day since, and it went down to the $16s, filling the "Mother of All Short Squeezes" gap, and re-testing the low of the Bullish Falling Wedge pattern that preceded it (the one in blue in the last post).


The Horizontal Red Trendline


That was "a reaction low," meaning that it was temporary support, and the stock got a bounce from there. It later got broken on the plunge to the $16s.


"Former support at 24.73 'should be' resistance" on the rally off $16. Was it? Yes. The rally high was 24.97, slightly above, then TZOO went down again.


Is that bullish or bearish? That's confirmation that the stock still is bearish, so shorting TZOO there, with a stop above 24.97, is "playing with the trend," and a very reasonable play.


Are there any patterns in the chart now?


Do we have any targets IN PLAY?


We know where resistance is (the red horizontal line). Do we know where support is?
Do we know where we'll exit the stock with a profit? Where is our stop loss?


Those are the questions that we want to ask ourselves when we take a position in a stock. If we don't know, or if we can't answer them, "When in doubt...stay out!"


TZOO - Technical Analysis 101 (Part 2)

(Click On Chart To Enlarge)

If we bought TZOO on the breakdown of the nested TRIPLE H&S Top near $50, predicated on some opinion that we had about the shorts "having" to get clobbered, or TZOO "being cheap," we would have been very unhappy campers when the stock sank into the 16s. We would have been sitting on a paper loss well in excess of 60%. UGH.


And, if we remained "stuck in that opinion," and didn't avail ourselves of the ONE opportunity go get out TZOO at $50 on the horrific short squeeze that finally did eventuate, we'd still be very unhappy campers, 2 1/2 years later: TZOO is at $22. UGH.


The Bullish Falling Wedge


In mid-April, 2006, after TZOO put in the parameters of the Bullish Falling Wedge pattern, that's where we KNOW that the shorts who stayed too long at the fair "could" be in BIG trouble.

If the upper trendline (connected by Blue #2 and Blue #4) gets taken out to the upside, watch out!

It not only got taken out, it was a HUGE gap up from 19.98 to 26.64, and TZOO went on a five-day "Mother of All Short Squeezes" rampage, to 52.24. Have mercy!

Actually, there isn't any mercy shown if we're caught short, and we don't cover. MERCILESS.


Could we KNOW that was going to happen? No, we can't "know the future," and certainly not the extent of the rally, but here's what we did KNOW:


1. That a Bullish pattern had formed, and we could measure the target IN PLAY "if" it broke out. The target was exceeded by a very wide margin, due to the effect of the short squeeze.


2. That the shorts were right for a long time, but if they were caught short on a breakout of a BULLISH pattern...oh, buddy! EXPLOSIVE power to the upside.


3. That TZOO didn't just breakout, it was a Breakaway Gap out a bullish pattern! (read about those at this Chart School link. Click on "Gaps And Gaps Anaylsis" down at the bottom: http://stockcharts.com/school/doku.php?id=chart_school:chart_analysis

TZOO: Technical Analysis 101 (2004-2005)

(Click On Chart To Enlarge)
"Hi Melf, If you don't mind, can you take a look at TZOO's chart? I'm learning TA now and TZOO really confuse me.


Thanks

Richard"


Hi, Richard,


Unfortunately, the constraints of my own workload don't afford me the time to analyze stocks that other people are interested in, however, since I've already done hours of chart analysis on TZOO over the years, and since there are so many things in the chart that are instructive (as there are in ANY chart), I'll go ahead and make an exception here, and offer you some comments.


My first comment is that if you are confused about TZOO (or any other stock), don't take any position in it. "When in doubt...stay out!"


Wait until you KNOW something. I don't mean "know the future," I mean KNOW what the chart is telling you. Let's look at several examples of that, beginning back in 2004-2005.


Pattern #1: Head & Shoulders Top (pattern in blue)


When TZOO broke below that neckline, Sell. And, it's fine to Sell Short there, because KNOW that the pattern broke down, which put a target of 70.76 IN PLAY, and that it's bearish.


Where would we KNOW that we might have it wrong? At a print above 96.95, which is the high of the Right Shoulder (RS) of the Head and Shoulders Top pattern. That "shouldn't" get taken out to the upside after the pattern breakdown, and if it does, we Buy To Cover our short, and take the loss.


I've got "shaken out" on a few of those, where the stock prints 97.00, stopping me out, then it tanks. That's very frustrating, to say the least, but the majority of plays WITH THE TREND will work out.


Pattern #2: The Second Head & Shoulders Top: (pattern in purple)


Same thing. Sell the neckline breakdown, and it's fine to Sell Short, too. We KNOW that it broke down, and we KNOW where we will put our stop if we Sell Short: above 84.29, the high of the Right Shoulder, same as last time.


Pattern #3: The Third Head & Shoulders Top: (pattern in red)


Do it again. We KNOW that the neckline broke down. Sell. And, Sell Short is fine again. After the breakdown, breakdown TZOO went back above the neckline giving the shorts a few days on The Anxious Bench, but than broke down again.


These three patterns form a "nested" (one within the other) TRIPLE HEAD AND SHOULDERS TOP. Very bearish!


At the time, short interest was huge...something like 60-80% of the shares were held short. So, we might conclude:


1. The shorts are wrong, and they're going to get clobbered.


2. TZOO had been at $110, so it was very cheap at $50.


3. TZOO also was cheap based on the fundamentals.


ALL of those three conclusions would have gotten us into trouble because we KNOW that the chart had a terrible bearish breakdown, and we would have gotten caught in "our opinion," rather than focusing on what we KNOW has happened in the chart.


Looking at the chart as it stood, it makes much more sense to conclude:


1. When a chart is bearish, the shorts are right.


2. In a bear market, "cheap can get a lot cheaper."


3. When the fundamentals and the technicals disagree, defer to the technicals to extent that it seems warranted. TZOO had put in a nested TRIPLE H&S TOP!!


That suggests significantly lower prices in the stock, and if we still like the fundamentals, we can buy it later on because we KNOW that we've been warned three times to GET OUTTA THERE.


Next post, we'll see what happened from there, and see if we KNOW anything different. Not "know the future," because we can't do that. But, we can see if we KNOW anything from the chart.


Friday, October 12, 2007

XING: Intraday Chart

(Click On Chart To Enlarge)
"Lastly, I'd like to ask you about the current chart situation of XING. I see a head and shoulders formation on the 120 minute chart. Am I seeing this right? If my understanding of a head and shoulders is correct, the neck line appears to be at $11.87 and the top of the head is at $13.26"


Doug,


You've basically got the right idea.


13.38, Yesterday's high, is the Head

11.53 - 11.52 is the neckline.


11.53 was the early morning low after Wednesday's gap higher

11.52 was yesterday's "reaction low," after the smackdown from the 13.38 high. That was "last support" from Wednesday, and XING was able to scramble higher from there, into yesterday's 12.07 close.


To get your downside target if the 11.53-11.52 neckline breaks, subtract the neckline from the high of the Head, then subtract your answer from the neckline break:

That gives us:

13.38 Head - 11.53 Neckline (I always use the more conservative of the two data points, 11.53 and 11.52) = 1.85 points.


11.53 Neckline break, minus the 1.85 points = Target: 9.68 IN PLAY.


Naturally, we'd want to see the 11.52 get broken, too :)


Targets are just "what the patterns suggest," and "what we're aiming for." No guarantees, and it also depends a lot on the quality of the patterns themselves, in terms of stucture, where they occur in the overall chart, and with respect to time, i.e. "is it just a two day pattern, or is it a two YEAR pattern? Big difference.

For example, this pattern is off a very short-term intraday chart, of only two days' duration. I wouldn't put as much store in it as I would in the QXM breakout of a rock solid four MONTH pattern that I posted this morning.


Nonetheless, given that this pattern has formed at the "bottom rung" of the resistance that we discussed this morning, I certainly would give a breakdown below 11.53-11.52 some credence.
EDIT: Doug, I've been trying for several hours to respond to you on the XING Message Board, with no luck. I'm getting the "Error Message 999" again. Sorry, I gave up :(


QXM - "A Perfect 10" Confirmation

(Click On Chart To Enlarge)

On October 10, we looked at the factors that contributed to QXM earning its "Perfect 10" rating. In just three days, QXM confirmed that it was deserving of that rating during a sizzling rally in which the pattern target of 14.59 got MADE (and, more!), for a gain of 36%, just from the breakout.


The gain was 61% if we bought QXM five sessions ago on October 4, at 9.04, on the "perfect re-test" of the Symmetrical Triangle breakout (pattern in purple).


Beautiful, beautiful chart. It took four MONTHS for the pattern to form; only three DAYS for target to get MADE, once it broke out. This is one for the textbooks.


Scores For Technical Merit:


10...10...10...10...10...10

XING: Rally Into Resistance

(Click On Chart To Enlarge)
From yesterday's post:


"We're now into October, and after going through that rollercoaster ride in that example, anyone who went through it finally got a chance to "break even" yesterday, if they bought at prices in the low 12.00s last winter.

"Whew! Lemme OUT!"

Not everyone will feel that way, of course, but many will. How many? It depends on how MUCH resistance there is. In this case, it's roughly September, 2006 to July, 2007, which is about 10 months, so fairly substantial."

In a nutshell, yesterday's trading activity was a very good illustration of how a "barnstorming" rally into resistance (10-month's worth) often plays out: a reversal, and a close in the red.

We can make excuses, and say that XING reversed to the downside because of the analyst's negative call on BIDU, "so all Chinese stocks went down." Or, "The whole market reversed, and went down!" Or, "We had weak-handed longs who bought the gap up opening and got trapped at prices above $13, so that's why XING sold off!

What have we got? EXCUSES.

Yes, anyone who bought XING yesterday over $13 probably got panicky and sold (weak-handed long). It's certainly reasonable to make that assumption. But, does that explain the reversal of ALL of the day's gains, and the closing in the red at "the bottom rung" of summer resistance (the June, July rectangle on the daily chart, the lows of which are 12.10 ...12.08 ...12.10)?

I don't think that it does. Why? Because we knew from our discussion yesterday morning that for the first time since the summer breakdown, the longs who have been trapped at prices above 12.10...12.08...12.10, going all the way back to late last year, were finally being given an opportunity to "get whole" in the $12s and low $13s, and to sell for a "break even." And, many players are trapped at prices higher than that, all the way up to $19. Some of them are willing to sell at a smaller loss, in the $12s and $13s.

What was their reaction (10-months worth of trapped longs) to the gap up opening? It varies, of course, but the "greed" factor that we all deal with goes something like this: "Gee, I've been holding XING at 13.00 for months. Now, it's finally trading above that! Oh, boy, I'm going to make some money on this. FINALLY!"

Then XING reversed to the downside. Now, the "fear" factor that we all deal with takes over: "OMIGAWD, I could have sold above $13 today, and now XING is tanking below that...now it's going back to UNCH....now it's gone red!"

PANIC.

And, not just panic from the "momo" crowd who just bought XING yesterday morning, but panic from trapped longs (10-months worth) who missed their opportunity (at least for the moment) to get out "whole."

We can say, "But, 'all' stocks went down yesterday!"

No, they didn't. Sinovac (SVA) and Gigamedia (GIGM), just two examples of stocks that don't have the kind of resistance that XING does, didn't reverse to the downside. They closed well in the green.

We don't want to make excuses for stocks. If we're AT resistance, let's try to be objective, and recognize that fact. Yesterday's rally was a "foray" into that resistance that failed, and closed at 12.07, right at the bottom rung of summer resistance: 12.10...12.08...12.10.

Very short-term: Everyone who bought yesterday at prices above the 12.07 close on a 3 million share reversal day, and who didn't sell the reversal is a potential "weak-handed long," who might want to sell on any rally here.

Longer-term: We've still got 10-months worth of "trapped longs" to work through.

Fundamentally, something like the release of an outstanding earnings report could trump the technicals, with something like a gap up above $12-$13 resistance, but absent that, yesterday's Volume Reversal Close left us at "the bottom rung" of resistance.


Thursday, October 11, 2007

XING: Weekly Chart Resistance


(Click On Chart To Enlarge)

A target of 16.10 is IN PLAY off the daily chart from yesterday's Cup & Handle breakout, but we can see from this weekly chart that it's a breakout right into about a year's worth of overhead resistance.

That's why I said to Shining yesterday in my "QXM: A Perfect 10" post that, technically, QXM is vastly superior to XING because it has NO resistance.

Looking at this BIG top and the subsequent breakdown in July, in this weekly chart, we can see that everyone who bought XING from about last September to the July breakdown (roughly $12-$19) had a nice paper gain at the highs, but had a sizeable paper loss at the August-September lows.

We've all "been there...done that," and we know how lousy that feels. We also know that if we bought a stock last January at 12.40, watched it rally to 19.92, for a 60% paper GAIN, and then watched that gain completely evaporate and then turn into a paper LOSS of 38%, that feels very lousy.

We're now into October, and after going through that rollercoaster ride in that example, anyone who went through it finally got a chance to "break even" yesterday, if that bought at prices in the low 12.00s last winter.

"Whew! Lemme OUT!"

Not everyone will feel that way, of course, but many will. How many? It depends on how MUCH resistance there is. In this case, it's roughly September, 2006 to July, 2007, which is about 10 months, so fairly substantial. Some of those people trapped above $12 already have sold, and some won't sell at all. They'll hold. But, we've still got to work through that ten months of overhead supply, coming out of base that has formed over a much shorter period: about 2½ months.

Someone on the XING Yahoo Message Board mentioned yesterday that this would be a great time for Wu to release earnings that, hopefully, will impress the market.

And, how! With XING right at resistance, that could help it to blast into resistance, and "would-be sellers" would be much less inclined to sell with the reporting of good earnings, and with the uncertainty about earnings removed.

Speaking of things being removed, I'd also like to see that downside target of 4.11 that is IN PLAY in this chart "get removed" by XING going back above the neckline. I mentioned Bodisen Biotech (BBC) yesterday. When it was at about $11, we had a downside target of something like $5 IN PLAY, which looked as equally ridiculously as this target does in XING.

BBC is now a pink sheeter, trading as BBCZ, at about $1.75. YEEKS :(

We want to see XING move well into this resistance, and hold at/near these levels because this big top wasn't pretty, and it's the primary reason why I decided for the moment to take what was behind Door #2: the 14% gain :)

Wednesday, October 10, 2007

XING: January Rally


(Click On Chart To Enlarge)

XING broke out of a Downward Sloping Channel (in Red) that had a "fractal" (a repeating pattern, in green) on January 16, putting upside targets of 14.22...14.89...17.20...and 19.05 all IN PLAY. I posted my chart and analysis ahead of the breakout, and posted the breakout in real time, at 3SOF's web site. It's still there in the XING file, if anyone wants to research the patterns, analysis, etc.

"Take Profits When Targets Get MADE," or at least some.

Getting out of XING at the final target of 19.06 based solely on the chart and the pattern targets IN PLAY saved a lot of headaches in this case. Yes, sometimes stocks go higher, but selling at 19.06 produced a nice profit from the breakout (44% gain), and XING didn't go much higher.

The 2007 high of 19.92 came in just five sessions later, and XING tanked to a September low of 7.65 where it could have been bought back at "next to nothing" during the decline with the 44% gain in the stock, if we sold it when the 19.06 target got MADE.

Buying it back at say, $10, the adjusted cost basis would be about $4. Pretty cheap!

XING: Cup & Handle Breakout


(C;ick On Chart To Enlarge)

The Cup & Handle Pattern is in green. The "handle" is the Bullish Falling Wedge (in purple) that broke out yesterday. The 11.94 target that was IN PLAY from that breakout MADE near the open this morning.

The Bullish Falling Wedge breakout also has a target of 12.84 IN PLAY.
This morning's Cup & Handle breakout puts a target of 16.10 IN PLAY, as long as XING continues to trade above 11.94-11.95. Below that, the target goes ON HOLD.

QXM - A Perfect "10"


(Click On Chart To Enlarge)

"THANK YOU MELF!

Excellent analysis! I would like to see YOUR ANALYSIS of QXM chart as well. QXM will be the DRIVER to XING valuation for a while until their COSUN busines proves growth.

XING owns 1.08 shares of QXM so just based on their OWNERSHIP XING should trade at $12.65 based upon QXM CLOSE. The QXM chart is quite BULLISH after this week's action and there is no RESISTANCE above $12. It broke WAY ABOVE trading band on over 5X AVERAGE volume."

Shining,

Thanks, and and also thank your for the information on QXM.

Due to my own workload, I normally have to decline requests for analysis, but I'm making an exception in this case because I bought XING yesterday, so it's in my own best interest to take a look at QXM since they're related ;)

My first comment is: I wish that I had looked at QXM before the breakout yesterday morning. "So many stocks...so little time." LOL.

My second comment is that QXM is a technician's dream.

Scores for Technical Merit:

10...10...10...10...10...10....

Here's why:

Pattern #1 Symmetrical Triangle (in red)
That pattern broke down on July 17, crossing 9.06, putting 6.80 IN PLAY.

Math for the target:

10.79 - High
8.53 - Low

10.79 - 8.53 low = 2.26 Points subracted from the breakdown at 9.06 - 2.26 = 6.80.

Targets are just "what we're aim for." QXM made a low at 6.92, shy of the 6.80 target, but "it ain't rocket science." I think we'd all agree that this pattern measurement did a darned good job of "ballparking" the target IN PLAY.

NOTE: This Symmetrical Triangle pattern (in red) later becomes recognizable as the Left Shoulder of the Bullish Inverse H&S pattern.

Pattern #2: Another Symmetrical Triangle (in blue)

Interestingly, this pattern broke out to the UPSIDE at the exact same number that the first Symmetrical Triangle broke to the downside: 9.06, putting an upside target of 11.26 IN PLAY.

Math for the target:

9.12 - High
6.92 - Low

9.12 - 6.92 = 2.10 Points + Breakout above 9.06 = 11.26 IN PLAY

After the breakout was when QXM starting racking up points for the "Perfect 10" score.

1. It rallied to 10.75, establishing the second data point on the neckline for a "possible" Bullish Inverse H&S pattern.

2. From there, it did an "a-b-c-" back flip to re-test the Symmetrical Triangle breakout AND to put in a Right Shoulder for the "possible" Inverse H&S pattern.

XNG nailed re-tested of the top of the Symmetrical Triangle within a penny, nailing that landing, and successfully re-testing that pattern breakout.

"Former resistance 'should be' support. It was.

NOTE: The Symmetrical Trianlge becomes the HEAD of the "possible" Bullish Inverse H&S pattern.

3. Bullish Inverse H&S Pattern (green circles)

Off the success re-test of the Symmetrical Triangle, and having established a low for the Right Shoulder, powered higher to neckline for the breakout, and was poised right below it at the October 8 close, beautifully positioned for the breakout with the "nested" Symmetrical Triangles in place, and after putting in a stunning technical performance.

At the open yesterday, October 9: KABOOM!!!!!!

1. Breakaway Gap opening at 10.70, just a hair below the neckline

2. Broke out above the neckline on BIG volume for this stock (1.7 million shares), indicating that players recognized the BIG pattern breakout.

3. The 11.26 target got MADE.

4. 14.92 is IN PLAY

Beautiful, Beautiful chart!

Shining, apologies that this was so long. Way-y more information than you wanted, I would suspect, but understanding these patterns and the techncials can be a very helpful adjunct to the fundamentals, if we're willing to take a look at them.

Good luck to you and to everyone playing XING and QXM. Of the two, QXM was vastly superior before the open yesterday, technically, and I would have played it instead of XING had I looked at the chart before this morning. Thanks for bringing it to my attention.

NOTE: Market opens in 40 minutes, so I don't have time to proof-read this. Apologies for any mistakes. I'll try to correct any later.

Tuesday, October 9, 2007

XING: Bullish Falling Wedge Breakout


(Click Directly On Chart To Enlarge)

Since the recent high at 11.94, XING has been struggling, technically. It went back below the channel in blue, it went below the July 25 low of 10.21, so this can't be the Right Shoulder of a Bullish Inverse H&S pattern. The Right Shoulder should be higher than the Left Shoulder.

XING has, however formed a Bullish Falling Wedge pattern (in purple), which only is bullish on a breakout above the top of the pattern, at 10.986 for today.

XING gapped up at the open, and just now printed 10.99, so it's broken out, technically.

The overall pattern since late July also looks like a Bullish "Cup and Handle" formation.

ASPV - Sell Into Strength


(Click Directly On Chart To Enlarge)

ASPV is up 25% from the August 16 Buy Pivot of 17.51, and up 17% from the September 13 Buy Pivot. Since the Bullish Inverse H&S fractal target of 21.82 got MADE yesterday, I decided to "sell into strength" yesterday, at 21.89, going into the close.

The 50-day (dotted green line) and 200-day (dotted red line) moving averages are inverted, and ASPV is above them, so the stock is "ahead of itself," from that standpoint. It still can rally, but stocks often "tread water," and trade sideways-to-down while the 50 DMA plays catch up.

Support is the neckline and the 200DMA, roughly at 20.17-20.12, respectively.

Monday, October 8, 2007

ASTM: Re-testing The Breakout


(Click Directly On Chart For Better Viewing)

October 3, ASTM broke out of a two-month Bullish Inverse H&S pattern, the neckline of which was 1.25 and 1.24. On the technical breakout of a neckline like that, we want to see a print of 1.26, a takeout of BOTH numbers, which we got.

Once it broke out, a target of 1.40 was IN PLAY.

Math:

1.24 - High (the more conservative of the 1.25 - 1.24 neckline)
1.08 - Low of the pattern

1.24 - 1.08 = 0.16 points + 1.24 = Target: 1.40 IN PLAY

It's just as valid to use the 1.25 high to measure, and many technicians do, but I like to be conservative. Using 1.25, would give us a target of 1.42 IN PLAY.

On the October 3 breakout day, ASTM closed at the high of the day, 1.37 on 2.5 million shares, which is very good volume for this stock, indicating strong buying interest on the technical breakout.

October 4, ASTM was indicated higher on some news, right at the 1.40 (or 1.42) target IN PLAY. From where the stock was postioned, just below the target, and well into the broken Ascending Triangle (June 6) resistance, that suggests a "Gap To Crap" on the news.

"Take profits when targets get MADE." The high on the day was 1.43 and ASTM since has come back to re-test the 1.25 - 1.24 neckline breakout. The low so far today is 1.25.

I like the fact that, longer-term, we've got a "possible" 14-month Double Bottom in place at the 1.10-1.08 lows, and shorter-term, I like the fact that the Bullishness of the Inverse H&S was confirmed when the pattern target got MADE.

ASPV: Inverse H&S Fractal Update


(Click Directly On Chart For Better Viewing)


From Thursday, October 4 post:

"...an Inverse H&S "fractal" (repeating pattern) emerged on this Hourly chart. It just broke out above the neckline a few minutes ago, which suggests that ASPV is going back up to the 22's."

The neckline of that fractal is 21.05 and 21.03. When it broke out, it put a short-term target of 21.82 IN PLAY.

Math:

21.03 High - (the more conservative of the data points, 21.05 and 21.03)
20.24 Low of the Head

21.03 - 20.24 = 0.79 points added to the breakout above 21.03 + 0.79 = 21.82 IN PLAY.

The high this morning just after the open was 21.81, within a penny of the target, confirming that the Bullish Inverse H&S fractal was, indeed, bullish.

EDIT: 21.81 was "close enough," but ASPV came back and printed 21.82 at 10:50AM, so the exact target ended up getting MADE on the new high for the day ;)

Sunday, October 7, 2007

ASTM: A Dem In The White House?

President Bush hasn't been particularly friendly to the stem cell stocks, but given the prospect of a Dem taking over the White House (we might even be saying MADAM President), it seems worth looking at these stocks now since the market is a mechanism that discounts the future, usually said to be six to nine months forward.

ASTM is stock that could benefit from that prospect, even if only due to the "perception" that a Democratic White House would be more friendly, rather than due to any actual results. Stocks often have very good rallies on "perception" alone, even if there's nothing, fundamentally, to support the rally.

Witness: Internet stocks that ralled hundreds of percentages, and more, but never earned a dime. Many of them went belly up, but not before people made a ton of money playing them.

A friend of mine told me just yesterday that she had the good fortune to sell CMGI at the top. That was the "internet incubator" stock. Incredible rally "on perception."

In addition to the "internet incubator" stock, it also should be dubbed the "Humpty Dumpty" internet stock, because it "...had a great fall...and hasn't been put back together again." LOL.

On to ASTM:

Technically, ASTM broke down from an Ascending Triangle that put at least a return to the bottom of the pattern, 1.10, IN PLAY, and possibly lower, to 0.86. Thus far, ASTM has Double Bottomed at 1.10 and 1.08.

Short-term, it has broken out above a weak-looking Inverse H&S pattern, but that's a step in the right direction and the fact that it's done something bullish, if only short-term, suggests that the Double Bottom has a good chance of holding.

I've drawn the Double Bottom, or "W"-Bottom at the top of the chart in purple. The key to the pattern is an upside takeout of the middle of the "W," which is 1.67, and have shown what upside target would be IN PLAY.

(Click Directly On The Chart For Better Viewing)


Long-Term Chart Review:

Pattern #1: The Double Bottom (which ended up being the Head of a Bullish Inverse H&S Pattern).

The width of that pattern is one year. Nice. The target of 1.10 that was IN PLAY from the breakout was exceeded by quite a bit in percentage terms. ASTM rallied to 1.83

Pattern #2: The FOUR YEAR Bullish Inverse H&S pattern.

"The bigger the base...the better the breakout," and was it! ASTM went on a 3-week upside screamer. A 200% rally! It was all over right there, but what a nice ride for anyone who caught it (I didn't). The upside target IN PLAY also was exceded by a wide margin on this breakout. Great example of how expolsive these pattern breakouts can be.

Pattern #3: Bullish Falling Wedge (pattern in purple, labeled #1 thru #4)

These usually aren't very good patterns. When they finally breakout, it turns out only to be a "break above" the pattern, as this one was in ASTM. There was a rally, but it never even got back to 1.88-1.90 resistance within the Bullish Falling Wedge.

The "good news" though, is that ASTM has spent about 1¼ years forming the nice Double Bottom base, which only is bullish if ASTM can break out above 1.67.

IF it does, past breakouts in this stock have resulted in the upside targets being exceded, and on a print of 1.68, EVERYONE who has purchased in the past 1¼ years finally will be sitting in a winning position, and they might not be real anxious to sell at that 2.18 target that would be IN PLAY since they've held it this long, and they'd be holding a winner.

Short-term, neckline support is 1.25. Longer-term, 1.68 is the technical breakout.

(Click Directly On The Chart For Better Viewing)