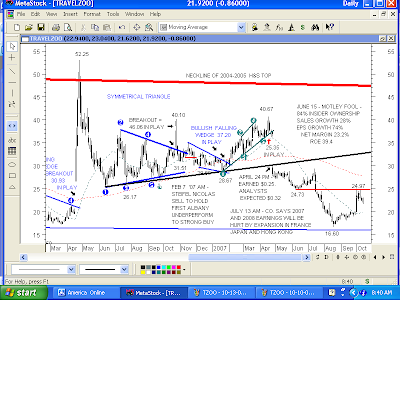
 (Click On Chart To Enlarge)
In the year and a half since the "Mother of All Short Squeezes," rally to $52, we can see several patterns that emerged, where they broke out or broke down, what targets were IN PLAY as a result, etc.
Most recently:
Bearish Rising Wedge (Pattern in Green)
That pattern broke down three days before the wicked gap down at the reporting of April earnings, putting 25.35 IN PLAY.
The Black Trendline
At the reporting of April earnings, they gapped TZOO down right below that trendline. We all hate to sell into a terrible plunge like that, but far more often than not, it's the right play when important support like that is broken. TZOO hasn't seen the $30 high of that day since, and it went down to the $16s, filling the "Mother of All Short Squeezes" gap, and re-testing the low of the Bullish Falling Wedge pattern that preceded it (the one in blue in the last post).
The Horizontal Red Trendline
That was "a reaction low," meaning that it was temporary support, and the stock got a bounce from there. It later got broken on the plunge to the $16s.
"Former support at 24.73 'should be' resistance" on the rally off $16. Was it? Yes. The rally high was 24.97, slightly above, then TZOO went down again.
Is that bullish or bearish? That's confirmation that the stock still is bearish, so shorting TZOO there, with a stop above 24.97, is "playing with the trend," and a very reasonable play.
Are there any patterns in the chart now?
Do we have any targets IN PLAY?
We know where resistance is (the red horizontal line). Do we know where support is?
Do we know where we'll exit the stock with a profit? Where is our stop loss?
Those are the questions that we want to ask ourselves when we take a position in a stock. If we don't know, or if we can't answer them, "When in doubt...stay out!"

2 comments:
Thanks, Oliver! Lots of lessons learned from TZOO, aren't there?
No, dang it, I didn't get filled on GIGM. After the gap up on Thursday morning, to 18.68, I put an order in at 18.42, a 50% retracement of the opening gap, but GIGM gave back almost nothing, and took off to the upside.
No problem. I was able to get into XING in the same gap up situation, on a 50% retracement, and that trade worked out fine.
Hey, I thought of you when I bought one of our old favoites, VPHM, on Friday. What a nice ride we had on that one last winter, especially after that beautiful, bullish DOUBLE Inverse H&S breakout, huh!?
I responded to you yesterday, BTW, but it didn' show up. Don't know what happened (?)
Hope that you're having a good weekend :)
Wow! That's great, Oliver. Glad to see you doing so well!
Best,
Melf
Post a Comment