The MACD in IBM is a great example of how we need to be careful about how we interpret buy and sell signals from indicators, and why we don't allow them to TELL US what to do.
The MACD topped out in early April and crossed below its signal line. View those crosses as "an invitation" to sell, and consider them in context with what is going on in the price chart. Crosses below the signal line are NOT automatic sells, nor are crosses above the signal line automatic buys.
The high in the MACD in early April was NOT a top in IBM, and the first cross in the MACD below its signal line not only wasn't a sell, it was a LOW in IBM, at 96.44.
Look at the TWO positive divergences in the Histogram, numbered in green. The MACD itself went lower to #2, the Histogram went higher. The MACD flattened out at #3, on June 27, and the Histogram went higher again.
Now, let's see what was happening in the price chart of IBM.

On June 27, when the MACD ticked higher off its SECOND positive divergence, IBM was sitting just below the top of the Symmetrical Triangle (pattern in purple), champing at the bit for a bullish technical breakout. The next session, IBM broke out of the pattern. The MACD, which had been acting as a leading indictor with its DOUBLE positive divergence in the Histogram, suggesting a bullish resolution, went up through its signal line the same day as the pattern breakout in the chart.
Pullbacks to pattern breakouts are common, and are to be expected. Ideally, after an upside breakout, the top of the pattern will act as support on any pullback. In this particular case, on June 3, the top of the pattern came in at 105.35. The low on the session was 105.11, which was a very minor shakeout of anyone who was rigid about the trendline.
This is high-priced stock, so to put that retest into perspective, if this were a $10 stock, the trendline would have been at 10.535 and the low would have been 10.511, within two cents of the trendline. That's ver-ry close. We can't expect exactitude of Ms. Market. If IBM had CLOSED below that trendline, I would view that differently. It wouldn't necessarily mean a failure, but it certainly wouldn't have been as bullish as the Dragonfly Doji that IBM put in that session.
On pullbacks to breakouts, intraday charts can be very helpful with seeing how the pullback is going, and with identifying patterns that might suggest that the stock is going to resume its move higher.

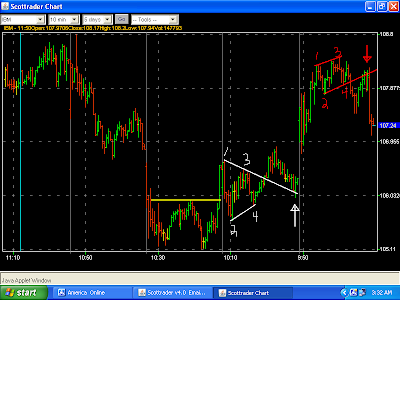
At the 105.11 low last Wednesday, IBM put in a Double Bottom, or a "W"-Bottom (synonymous). The middle of the "W", 105.95, is the Buy Pivot. That's the yellow horizontal line. This was a skimpy little pattern in terms of width, but basis the daily chart, this Double Bottom came in right where we would expect that it should, near the 105.35 top of the Symmetrical Triangle (pattern in purple in the daily chart above). Very nice.
Thursday, IBM put in a Symmetrical Triangle (pattern in white) and broke out of it, putting an upside target of 107.45 IN PLAY.
106.65 - High of the pattern
105.60 - Low of the pattern
106.65 - 105.60 - 1.05 points of upside from the breakout, at 106.30.
106.30 + 1.05 = Target: 107.45 IN PLAY
Notice the "fractal behavior" (repeating pattern) in IBM. This intraday pattern (in white) was a Symmetrical Triangle, like the one in the daily chart, and the minor violation (white arrow) of the top of the pattern on the retest violated the trendline slightly, like the retest did in the daily chart.
Off that successful retest Thursday afternoon, IBM was "good to go" and gapped higher at the open on Friday, to 107.33. The prior day's high was 106.87. I liked IBM well enough to buy it at 106.95 on the pullback to fill the gap, but I didn't like the gap up in the general market well enough to stay long in the trade. It looked like it was going to be a sideways-to-down day in the market.

Gain: $600. A small gain, but we're favored to win plays that are WITH the trend, especially when we've got a decent "Body Of Evidence" that it's bullish, going into the trade:
1. The Symmetrical Triangle breakout in the daily chart was BULLISH.
2. The successful retest of that breakout was BULLISH.
3. The Double Bottom breakout above 115.95 in the intraday chart was BULLISH.
4. The Symmetrical Triangle breakout in the intraday chart was BULLISH.
5. The successful retest of the Symmetrical Triangle breakout in the intraday chart was BULLISH.

No comments:
Post a Comment