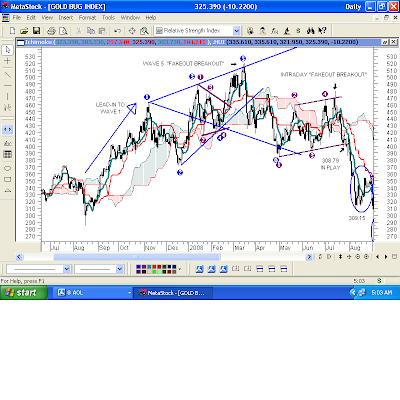
In early 2008, the HUI completed a Bearish Wolfe Wave. The key elements are:
1. A strong directional move (the arrow) to a Wave 1 Top.
2. A channel or wedge with Waves #1- #4 that form in the direction of the Lead-In (arrow).
3. A Wave #5 "Fakeout/Breakout," which in my view, is the hallmark of a Wolfe Wave. It's purpose, after a seemingly never-ending move in one direction, is to put the proverbial "everyone" wrong-footed at the Wave #5 fakeout, having both longs and shorts "buying and buying to cover" at exactly the wrong time.
4. The Wave #6 Target line is derived by connecting the high of Wave #1 and the low of Wave #4.

After the Bearish Wolfe Wave target MADE, the HUI went into a Bear Flag/Rising Channel, broke that, then tried to form a Bullish Inverse H&S, which failed. With the latter, instead of taking the measurement of the pattern and adding it to an upside neckline breakout, we SUBTRACT the measured move from the low of The Head when it fails. The downside target al-lmost got MADE, within one dollar.

Off the low, the HUI put in a skimpy "W"-Bottom, or Double Bottom, similar the the skimpy one that we looked at in Cleveland Cliffs (CLF). The target for this one also got MADE, regardless of which leg we used to measure the target.
In the current time-frame, we've got a possible Bearish Wolfe Wave again, and the minor Wave #5 Fakeout/Breakout also looks to be part of a 3-day Bearish Evening Star pattern, one of the most bearish in the candlestick patterns, if it holds up.

As with everything in technical analysis, there's no "always." This possible Bearish Wolfe Wave in AZO did NOT play out. It got trumped by the fundamentals, on earnings in early March.
You might remember that I shorted this one the day after the Bearish Doji Star Hangman breakout candle, on earnings. That candle was on very heavy volume and looked like it might reverse to the downside, but I threw it in for a $35 gain when it didn't.
Several sessions after the upside breakout, we can see that AZO found support at the top of the channel for two sessions, then continued higher. That actually was a VERY nice buy when the top of the channel held (former resistance became support). The 8 and 13 RSI's both came into Bullish Synchronicity, then gave a Buy Pivot signal. I wasn't watching it. "So many charts...so little time." LOL.
Currently, AZO is trading in another more steeply upward-sloping channel, which also has the look of a Bearish Wolfe Wave. The big directional "Lead-In" would be off the February 18 low (Blue #4), prior to earnings. AZO would need to have a Wave #5 upside Fakeout/Breakout up at the top of the channel, then failure, to be a Bearish Wolfe Wave.
It also could simply break the lower trendline (Red #2 and Red #4).
As it stands, though, AZO still is acting bullish off the upside Breakaway Gap, and off the successful retest of the top of the BLUE channel.

2 comments:
I see Gold on trendline, and I think it may breach this trendline and begin going lower, thus confirming bearish wolfe wave(never heard of before). In addition I never heard of a failed inverse H&S can be drawdown to new lows. If that is the case would we be taking the S&P failed Inverse H&S with low @750 and neckline @950 to give us a low of 550?? Where did you get this failed inverse H&S gives you a drawdown? Thanks.
j0sh,
I don't remember where I read that the measurement for a failed Inverse H&S can be subtracted from the low of The Head on a failure, it's been so long, but it made sense to me and the target measurement often works, as it did in this example of the HUI (within one dollar).
Remember that ANY pattern measurement only is what is "suggested," and that they don't always get MADE.
In the S&P example that you gave, that doesn't look like a failed Inverse H&S to me.
Post a Comment