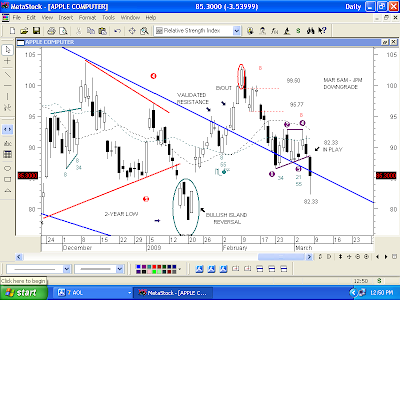
Analyst upgrades and downgrades often are great sources for finding good opportunities in the market. Sometimes they're a good fade; other times, the call is a correct indication of near-term direction.
Even if we aren't following a particular stock on which an analyst makes a call, if we have a quick peep at a chart, we can get a good idea of whether or not the call is going to have much impact by looking for potential pattern breakouts/breakdowns, trendline support and resistance, etc., in response to the call, and take action accordingly.
Friday morning, JP Morgan downgraded AAPL, a stock that I like to follow. APPL was sitting at the bottom of an Ascending Triangle as of Thursday's close, and was looking vulnerable to the downside (which some technical analyst at JP Morgan probably recognized, so he bit into it before the bell...LOL). Thursday's low was 88.45. The Ascending line came in on Friday at 88.59.
In response to JP Morgan's call, AAPL had a Breakaway Gap down out of the Ascending Triangle, to 88.34, printed a high of 88.40 leaving a five cent gap on the chart, and started lower very quickly. Breakaway Gaps are like that, not allowing anyone out (or in, if it's an upside gap) at yesterday's prices. The pattern breakdown put a downside target of 82.33 IN PLAY.
Math for the target:
92.77 - The more conservative of the 92.92...92.77 highs of the pattern
86.51 - Low of the pattern
92.77 - 86.51 = 6.26 points of downside from the trendline break, which was 88.59.
88.59 - 6.26 points = Target: 82.33 IN PLAY
AAPL sold off 82.33 exactly, the low of the session. We can't expect that kind of exactitude out of targets, but they often do come very, very close. It would be just as valid to have used the 92.92 high of the pattern to establish the target, in which case the target would have been 82.18, but this is an example of why I like to use the more consevative of the highs (or lows). I don't like to over-expect. Bottom line: when you get close to a target, especially when it is close to getting MADE this quickly, take the money!
NOTE: Ascending Triangles usually are bullish. Some sources tell us that they ALWAYS are bullish. We know that there is no ALWAYS in the stock market. This one obviously wasn't bullish.

These Fibonacci sequential measures of Relative Strength, combined with basic chart patterns, did a very nice job on several recent occasions of telegraphing weakness in AAPL.

No comments:
Post a Comment