From pre-market Friday morning:
"I played it long from 92.48, but threw it in for about a $180 gain when it looked like the breakout wasn't going to hold on a closing basis. It didn't."
On Friday morning, IBM gapped up to 93.18, looking like Thursday's Fakeout/Breakout was, itself, a fakeout! Well, okay, I got back in at 93.28 and trade looked fine as IBM rallied to 95.00.

Have you ever been in a trade, thinking, "You HAVE to be joking!?" Off the 95.00 high, IBM formed a Symmetrical Triangle and broke to the downside. After the pattern breakout in the daily chart, above the 93.00s, one would expect that Symmetrical Triangle to be a BULLISH continuation pattern, and not see IBM break to the downside and head back toward 93.00. But, that's just what it did :(
When I saw the trade coming back in my face, I threw it for the second day in a row, at 93.34, for a paltry gain of $50. Sheesh.
Friday's candle is a Bearish Inverted Hangman. IBM still could break out again if the SPX rallies and knocks out key 803-804 resistance, but I haven't enjoyed the two "false starts" on Thursday and Friday's breakouts. LOL.

On March 6, AAPL broke down below the Bear Flag (in purple) on a JP Morgan downgrade. The target of 82.33 got MADE to the exact penny, then AAPL reversed and came roaring back to the 103 area where it found resistance, beginning with the 103.68 December high, then the highs of 103.00 and the recent 103.48. If AAPL can take out those highs, next resistance is the October high of 116.40. The recent $20 rally off the 82.33 low has been fairly parabolic, though.

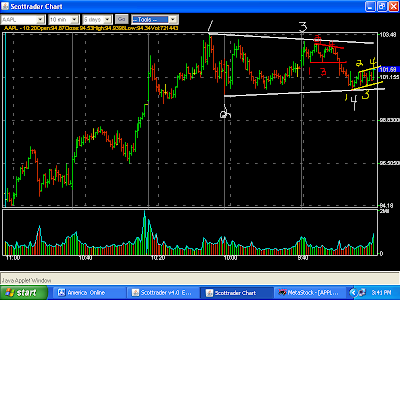
This morning's big gap up in the futures has me suspicious, especially when I look at charts like this Triple Nested Symmetrical Triangle in AAPL. The pattern in red is a Descending Triangle (usually bearish), and the pattern in yellow is looking like a Bear Flag at the moment.
If AAPL has an upside gap at the open, it could be a "Gap To Crap," especially given the parabolic nature of the rally in the daily chart, and this toppy looking nested pattern in the intraday chart. If it's a "Gap And Go" above the $103's, then never mind. LOL.
I can't figure out why this last section is underlined. Sorry about that.

2 comments:
Melf,
Two posts in a row for me. as I stated, usually just lurk. I have traded aapl in the past. thank you
Good Morning, John,
That was a nice move in AAPL yesterday. I'm going to update the chart in a bit.
Post a Comment