Thursday, April 30, 2009

SPX And FSLR


From Monday, April 20 pre-market comments, when we were at the top of the Bearish Wolfe Wave/Bearish Rising Wedge (Red #5 on the chart):

"The proverbial "everyone" seems to be looking at the current Bearish Rising Wedge, which always makes me a bit nervous. LOL. Sometimes, though, "everyone" is right, at least for a time, as we'll see in the next chart."

It turned out that the proverbial "everyone" WAS right, at least for the time that it took to get to the Wolfe Wave target line (#6). Most sources on technical analysis tell us that when a Bearish Rising Wedge breaks down, the target is the bottom of the wedge, which is Red #2 on this chart. Be careful about that, especially when the trend is bullish, which it has been in the SPX off the March low, and MOST especially when the proverbial "everyone" is wanting it. The selloff from the top of the Bearish Wolfe Wave was more shallow than most were expecting or wanting.

From April 28 comments:

"The Bulls would need to show some muscle to blast through SPX 875-877.

Here are two examples of how they could do it:

1. Sell off "some," to Blue Data Point #4, for a Bull Flag (a low that is slightly lower than the 826.83 of April 21, which is Blue Data Point #2). OR...

2. Sell off to a low that is higher than that, for a Symmetrical Triangle, then break out above SPX 875-877. A Symmetrical Triangle is "lower highs" and "higher lows." The trendlines converge (eventually meet up with each other)."

We can see from the pattern in white that the Bulls' pattern of choice to flex some muscle was Example #2, the Symmetrical Triangle. The Bulls broke out of it ahead of The Fed, came back and retested the top of the pattern after The Fed announcement, violated it a bit, then closed the session out above the breakout. As the chart stands, The Bulls are in control.

EDIT (5:29AM): Forgot to post the target. SPX 918.30 is IN PLAY as long the index trades above the top of the Symmetrical Triangle.

For The Bears to turn this chart from Bullish to Neutral, they would need to take the SPX back below the top of the Symmetrical Triangle. To turn it at all bearish, they would need to take out:

1. "The last low," which was 854.60 in the final hour on Tuesday.
2. The bottom of the Symmetrical Triangle pattern (White Trendline #2-#4), which also is a validated trendline. The low at White #4 came ver-ry close to nailing that trendline, but Bulls stepped in and bought it.
3. The 847.12 low, at Data Point #4.

When drawing patterns, I start at a high or a low, or BOTH, if that's appropriate, and in this case, it is.

In the first chart, we started at the Bearish Wolfe Wave #5, and labeled that HIGH White #1. The next low is White #2. The rally from White #2 to White #3 probably is what E-Wavers would call and A-B-C affair. There was an intervening high (A), low (B), and final high (C), which also is White #3. We came down to White #4, (the near-trendline validation), then broke out of the Symmetrical Triangle.

In this chart, we started the labeling of White #1 with a LOW. What have we got? A pretty well-defined Rising Channel. Data Points #5 and #6 didn't qui-ite tag their respective trendlines, but "close enough" to tell us, "Yes, Trendline #1-#3 IS support, and, Yes, Trendline #2-#4 IS resistance."

If the SPX, for example, should break below Trendline #1-#3-#5, that's a victory for The Bears. There's always a chance of a false breakdown, but if it breaks down, gets retested and FAILS, that would be a pretty good indication that we're going down.

At the moment, though, The Bulls have broken out of the Symmetrical Triangle in the first chart and SUCCESSULLY retested the top of the Symmetrical Triangle, so they still are in control.

FSLR was my "go to" stock last week. I played two Ascending Triangles off the intraday charts. Both of those targets got MADE.

In the daily chart, FSLR has formed a QUADRUPLE nested Symmetrical Triangle, meaning that there are four distinct patterns nested within the Big Symmetrical Triangle (pattern in black).

FSLR broke out of the recent Symmetrical Triangle (pattern in green)and is sitting "champing at the bit" for a breakout. I didn't want a position ahead of earnings. No matter how good a chart looks, the technicals always can be trumped by the fundamentals.

In this case, though, it looks like FSLR reported a big beat after the bell, so the stock likely will come out of this QUADRUPLE nested Symmetrical Triangle on a Breakaway Gap. As we've seen so often, nested patterns and multiple patterns can pack some punch when they break out or break down, so the gap up could be a big one. If it isn't, I likely will try to buy FSLR today on a gap fill or at the top of the Symmetrical Triangle, if I can.

Yesterday's high was 156.36, so an open above that would be a Breakaway Gap. In that event, a print of 156.37 would be a gap fill. For the technical breakout of the BIG Symmetrical Triangle (pattern in black), the top of it comes in today, April 30, at 155.393.

Wednesday, April 29, 2009

AAPL - Ascending Triangle


In yesterday's Comment Section, Jegejig asked:

"Would two data points be enough for the uptrend line with a flat top to form the ascending triangle?

For some reason, I thought there were supposed to be 3."

Yes, with ANY pattern, only two data points for the highs and for the lows is enough for a pattern formation. A third "hit" to any trendline is called a trendline validation, telling us, "Yes, that IS support (or resistance)."

In AAPL, the Bullish Falling Wedge (pattern in blue) "morphed" (changed) into the Ascending Triangle (in black). That kind of "morphing" is fairly common in charts, and we've looked at a lot of examples over the past few months.

In this particular Ascending Triangle (pattern in black), there are only two data points for the ascending line, and we can see that it worked out fine. In fact, the rally after Data Point #4 was established has been nearly parabolic. Notice that one a the few little pullbacks to speak of was on March 30 (green arrow), and interestingly, that pullback was a trendline validation, telling us, "Yes, the breakout IS valid. The top of the Ascending Triangle used to be resistance. It now IS support."

Off that trendline validation, AAPL rocketed higher toward its Ascending Triangle target.

EDIT (5:44AM): I just went back and read my analysis on AAPL from March 24, (the day that it broke out of this Ascending Triangle) part of which was, "Daily chart is looking real decent. AAPL has "turned the corner" higher, above the 103 Triple Top, and sits at a multi-month high."

We all have a lot of charts to follow, but a REALLY nice play would have been to put in a buy order near the $103 breakout, to try to pick it up on any pullback. The order would have gotten filled several sessions later, on the March 30 pullback (green arrow) to 102.61.

Coulda...shoulda...woulda...LOL.

Tuesday, April 28, 2009

SPX - 875-877 Continued


After two rejections (the red arrows) at the bottom of the Bearish Wolfe Wave (trendline #2-#4), the SPX sold off a bit yesterday on "swine flu fears."

The MACD also turned down from below its signal line, so we've got a possible "Kiss of Death" signal. Remember that indicators don't know what the chart looks like, and that they aren't TELLING US what to do.

For example, when the MACD fell below its signal line (red arrow) on April 22, the SPX closed at 845. The next session, the SPX put in a low of 835 near the Bearish Wolfe Wave target line (#6), then rallied 36 points, to 871, on Friday, April 24. So, a cross below the signal line isn't an automatic sell, nor does it mean that we immediately are going straight down (and, we didn't).

Yesterday's rejection at/near the MACD signal line is another "piece of evidence," and in the price chart, we know that we have TWO rejections at the bottom of the Bearish Wolfe Wave (the two red arrows in the price chart above).

Although the neckline of this putative H&S Top in the MACD hasn't broken, the fact that it's rolling over is an indication from this particular indicator that "the Force isn't with the Bulls," and it suggests at least "some" short-term weakness. The Bulls would need to show some muscle to blast through SPX 875-877.

Here are two examples of how they could do it.


1. Sell off "some," to Blue Data Point #4, for a Bull Flag (a low that is slightly lower than the 826.83 of April 21, which is Blue Data Point #2). OR...

2. Sell off to a low that is higher than that, for a Symmetrical Triangle, then break out above SPX 875-877. A Symmetrical Triangle is "lower highs" and "higher lows." The trendlines converge (eventually meet up with each other).

The example shown in this chart is the Bull Flag scenario. Trendline #2-#4 would point UP for the Symmetrical Triangle scenario.

Remember, we're not predicting. We're observing, and trying to follow Ms. Market as best we can. We don't want to assume a bullish or a bearish resolution.


Yesterday, I mentioned that if we take out SPX 804, that would blow any chance of putting in a Right Shoulder of a Bullish Inverse H&S pattern because 804 would be the low of a Left Shoulder. A Right Shoulder low should be higher than the Left Shoulder Low.

I also mentioned that if we do take out SPX 804, we still could do something like put in an Ascending Triangle, an example of which I've drawn in this chart.

We would need to establish Black Data Point #4 "somewhere" below 804, connect Data Point #2 (the March low) to whatever low we would make at Data Point #4 to establish the ascending line, then go up and knock out SPX 875-877 for a bullish Ascending Triangle breakout.

Monday, April 27, 2009

SPX - 875-877


Review of our discussion about trendlines, from Monday, April 20:

"In the current time-frame, this still has the look of a Bearish Wolfe Wave. As I'm sure you've noticed, technicians often draw patterns and trendlines differently, which is their privilege. My view is "use what works." I would have used the high and low of the area that I've circled in blue, but it doesn't work. The trendlines go slicing through the candles that follow and I won't do that because, in my view, that renders any significance of the trendlines useless. If a bar opened or closed on a trendline, violated it slightly, then reversed, I would use it. Otherwise, I can't use "willy nilly" violations of trendlines. That's just my opinion, of course."

At that time, the SPX was at Data Point #5, at the top of the Bearish Wolfe Wave. Since then, the Wolfe Wave target got MADE, at Data Point #6, then the SPX reversed to the upside and chased the bottom of the pattern (Trendline #2 - #4). We've gotten two trendline validations, at the red arrows. Both were back tests of the bottom of the pattern, and on both occasions, the SPX backed off from the trendline, telling us, "Yes, that is resistance." Friday's retest came within eight cents of the trendline before the SPX eased off.


Since the high of SPX 875.63, at Data Point #5, the MACD has gone down below its signal line and on the rally back-testing the bottom of the Bearish Wolfe Wave, the MACD also has rallied to back test its signal line. That sets up a "Kiss of Death" failure in the MACD if it should turn down from here, and also sets up of "mini" H&S Top in the MACD.

Downside targets would be SPX 826.83, where the Bearish Wolfe Wave got MADE at Data Point #6, and SPX 814.84, which is the bottom of the Bearish Wolfe Wave, at Data Point #2.


Bigger picture, basis the Ichimoku Kinko Hyo chart (At A Glance...The Table Of Balance), the recent high at SPX 875.63 sets up a possible neckline (horizontal purple line) for a Bullish Inverse H&S pattern. The Left Shoulder would be the January-February Symmetrical Triangle (in purple), which I really should label an Ascending Triangle since the highs were so flat (875 and 877). The low of that possible Left Shoulder is 804.30, so for there to be a case for a Bullish Inverse H&S pattern, that low should NOT get taken out.

A few comments on this Ichimoku Kinko Hyo chart:

1. Notice that on the first rally off the November low, the SPX rallied through the Kumo (Cloud), represented by the vertical lines, and closed above it for just one day, on January 6. That rally formed a Bearish Rising Wedge (pattern in black), and when it broke on January 9, down she went.

2. Off the SPX 804.30 low in January, the rally ended at about the middle of the Kumo and when the Symmetrical Triangle/Ascending Triangle broke down on a Breakaway Gap on February 17, down she went again.

3. The initial thrust off the March low al-lmost got to the top of the Kumo (Cloud) then sold off, but it was different this time. Instead of going down below the Kumo (Cloud) on the selloff as it did on the last two rallies, the SPX held its ground inside the Kumo, then thrusted well above it on a big white candle, on April 2.

The first selloff from April 2 found support at the 8-day Tenken-sen (solid green line). The next selloff found support near the 21-day Kijun-sen (solid red line).

4. We can "See At A Glance...The Table Of Balance" that the SPX now is well above the Kumo, which is about 100 points below here, currently at SPX 770-772. Just as the Kumo acted as resistance and shut down the rallies off the November and January lows, it "should" act as support on any selloff to that level.

Summary: As mentioned, a selloff below SPX 804 would negate the Bullish Inverse H&S possibiltiy, but below that level, the SPX "could" do something like put in Data Point #4 of an Ascending Triangle.

Structurally, in my view, a selloff from this SPX 875 level to form some larger pattern would support a more sustainable rally on any future upside takeout of SPX 875-877. "The bigger the base...the better the breakout."

Just a few things that I'll be watching on a selloff, although I'm not assuming anything. I like the expression, "When we ASSUME, we make an ASS out of U and ME." LOL.

Saturday, April 25, 2009

AMZN, QLD, FSLR, GLD And JOYG


The initial response to AMZN's earnings after the bell on Thursday was negative, but by the open on Friday, the response was VERY positive. The Cup & Handle target of 82.24 from the January 30 Breakaway Gap got MADE, nominally (within six cents), at Wednesday's high of 82.18, but AMZN had a lot more in it on the upside on Friday, much of it having to do with a squeeze on the shorts since AMZN was at a new high off its move from the 34.68 November low. At yesterday's high, AMZN was up a sizzling 150% since last autumn.

I like a stock that "hits its marks" like this. The Bull Flag, the Bearish Wolfe Wave and the Cup & Handle targets all got MADE.

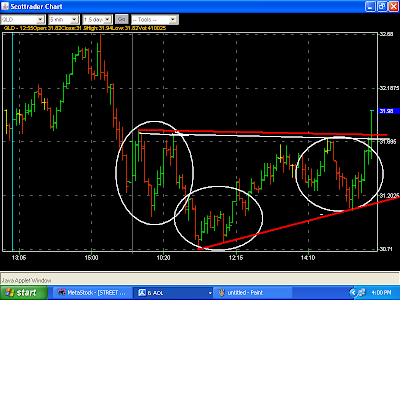
In addition to the favorable response to AMZN's earnings, further indication of a rally on Friday was this late day breakout in the QLD on Thursday afternoon that put 32.76 IN PLAY. I was concerned about a possible "Fakeout/Breakout" at Thursday's close, but Friday morning's opening indication suggested that the breakout was for real.

Math:

31.76 and 31.73 - Neckline
31.75 - Is where the neckline was when the 30.71 low got put in

31.75 - 30.71 = 1.04 points of upside on a breakout, which was at 31.72.

31.72 + 1.04 = Target: 32.76 IN PLAY

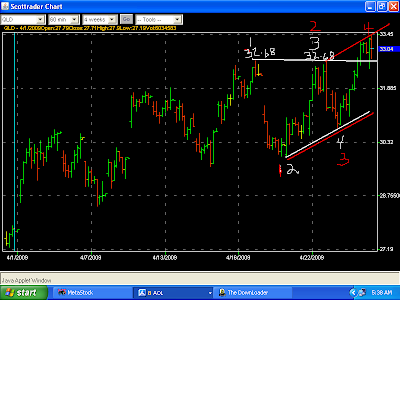
A problem for The Bears in Friday's session was that when the 32.76 Bullish Inverse H&S target got MADE, in the hourly chart, that was a technical breakout of this Ascending Triangle (pattern in white), the highs of which we an identical 32.68. That breakout propelled the market even higher, further squeezing the shorts, who would like to see the Ascending Triangle "morph" (change) into a Bear Flag (pattern in red).

Friday morning, when I saw that the Thursday afternoon Bullish Inverse H&S Bottom in the QLD was going to hold up, my "go to" stock was FSLR, which I had played on Wednesday. It was called gap down to 143.00 where I got long, but it had this potential Ascending Triangle in place which broke out very shortly after I got long. That put a target of 148.67 IN PLAY.

Math:

144.71 - the more conservative of the 144.74 and 144.71 highs
140.75 - low of the pattern

144.71 - 140.75 = 3.96 points of upside on a breakout.
144.71 + 3.96 = Target: 148.67 IN PLAY.

Comment from my Wednesday long play in FSLR:

"Although 149.06 was IN PLAY when FSLR broke out again, given that the general market has broken those Bearish Rising Wedges that we've all been watching, I wasn't going to be that ambitious with my upside target. I decided to play it to 144.72, 50% of the gap (the red horizontal lines). My sell order got filled at that price. Gain: $1,275."

On Friday, given the breakout in the QLD, I was more confident about the 148.67 target getting MADE. It did, and I sold FSLR right there. Gain: $2,825.

The bullish case for the GLD improved on Thursday when the 88.45 pivot of the "W"-Bottom, or Double Bottom (synonymous) got taken out. The pivot is the little candle circled in red.

The bullish case improved even more on Thursday when the top of the Bullish Falling Wedge got taken out, intraday. Friday morning, the top of the Wedge came in at 89.04. The GLD was called Gap Up, so I place a buy order right there. It opened at 89.10 and rallied, so I didn't think that I'd get filled, but I did on a pullback.

I was busy wanting to get long FSLR at the open, but in retrospect (hindsight always is 20/20) it would have been MUCH better to get long the GDX, which rallied about 6%. The GDX rallied only about 1%. Oh, well...I'm happy to have made anything at all after scratching my head over the GLD charts recently. LOL. I sold it near the end of the day. Gain: $375.

I shorted JOYG again for the reasons that I cited earlier in the week. At least I got back the $275 that I lost in it on Wednesday ;) Gain: $550


Gain on the session: $3,725. Gain on the week: $7,350. Two-week gain: $22,850.

Hopefully, these posts the last two weeks have been instructive on the patterns, targets, actual plays, etc. I'll continue to post them once in awhile, but not on a daily basis, which takes a good bit of extra time. Again, the basic idea is to have a plan, try to set up good risk:reward plays, and to manage our money well.

Friday, April 24, 2009

MS, QCOM And QLD


This is one of those charts that just looks like it's going to "fall of its own weight." Scottrade only had 2,356 shares available to short, so I went with that and shorted MS at 22.55. It fell to 22.02, bounced, and came back down again. I covered at 22.04 figuring that it might briefly double-bottom and give me a chance to re-short it at a higher price. It fell right through 22.02 and went down to 21.16, so I didn't get the chance. MS recovered to 21.96 at the close. Gain: $1,200.

QCOM had a "Gap To Crap," or, "Gap And Crap" at the open, on news that lawsuits with BRCM might get resolved, and news that QCOM will reports earnings on Monday that meet or exceed expections. QCOM sold off from the open, went red, and looked ready to take Wednesday's late afternoon low of 33.97 (horizontal red line), where I shorted it. That was a late entry, so I only gave it a twenty cent stop, at 40.17.

When a stock reverses like QCOM did, it can have an ugly day. I was wanting a selloff into the end of the day, down toward the neckline of what appears to be a H&S Top. I didn't get it, and got stopped out. Loss: $500.

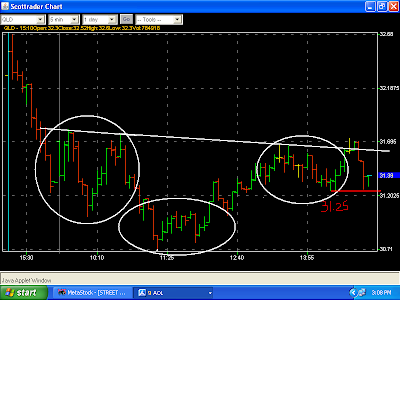
The QLD looked like it was going to mount a late day rally. I got long, with a stop below 31.25, which looked to be the low of a Right Shoulder of a Bullish Inverse H&S pattern. Shortly after I got long, the QLD sold off. I didn't like that action and all, and didn't wait for the 31.25 to get busted, figuring it might go down hard in fast market conditions. I sold at 31.27. Loss: $1,000.

It turned out that I had the right idea, but it still cost me $1,000.


The pattern "morphed" (changed) into this Bullish Inverse H&S (pattern in white), or Ascending Triangle (pattern in red) and did stage the late day rally. Curses!

Loss on the day: $300.

Thursday, April 23, 2009

IBM, FSLR And JOYG


From yesterday:

"I also realized that shorting IBM, at all, was a mistake. If anything, I should have gotten long the open, with a stop below the channel. I played what I thought IBM was going to do, rather than what it is doing."

In the Comment Section a week ago, Mark asked me if I reviewed my losing trades as well as my winning trades, to see where I went wrong on the losers (paraphrased). Boy, I sure do! Probably more so on the losers than on the winners, so that I can make an effort not to repeat the same mistake. I still do dumb things, though :(

Knowing that IBM is acting bullish, I tried to get long it yesterday morning at 101.01, just above the 101.00 target that was IN PLAY from this Rectangle breakdown when I saw that IBM (and everything else) was called down at the open.

Math:

102.48 - Highs of the pattern
101.74 - The more conservative of the 101.74 and 101.72 lows

102.48 - 101.74 = 0.74 points of downside from a breakdown

101.74 - 0.74 = Target: 101.00 IN PLAY

Evidently, Ms. Market intends to punish me for my poor play of IBM on Tuesday because yesterday's low was only 101.06, and I didn't get filled on my order to Buy at 101.01. Lord, she can be a cruel mistress. LOL.


Also from yesterday:

"I played what I thought IBM was going to do, rather than what it is doing. What IBM "is doing," is still acting bullish, still within the channel, and still with TWO upside targets IN PLAY."

Yep. The 103.32 Rectangle target (pattern in blue) got MADE yesteday.


In FSLR, I liked Tuesday's gap fill of 135.69 left on the chart from April 8. Tuesday's low was 135.60, and that low also established Data Point #4 for a possible Symmetrical Triangle (pattern in green).


In addition to the Symmetrical Triangle in the daily chart, basis the intraday chart, FSLR had formed this Ascending Triangle, with highs of 142.38 and 142.33. A breakout would put a target of 149.06 IN PLAY.

Math:

142.33 - the more conservative of the two highs
135.60 - the low, and the gap fill from April 8

142.33 - 135.60 = 6.73 points of upside on a breakout

142.33 + 6.73 = Target: 149.06 IN PLAY

FSLR opened down, had a nominal breakout to 142.60, sold off to 140.13, then came on again. I got long at 142.13 on that second rally. Although 149.06 was IN PLAY when FSLR broke out again, given that the general market has broken those Bearish Rising Wedges that we've all been watching, I wasn't going to be that ambitious with my upside target. I decided to play it to 144.72, 50% of the gap (the red horizontal lines). My sell order got filled at that price. Gain: $1,275.

I was real happy with that, until I saw...

... that the Ascending triangle target of 149.06 actually did get MADE. Sheesh. Isn't greed a terrible thing? LOL.


JOYG broke out of a Symmetrical Triangle (pattern in green) that failed, and appears to have "morphed" (changed) into a Bear Flag/Rising Channel (pattern in blue). In early trading yesterday, the stock rallied to 24.43, filling the gap in the chart (horizontal red lines) entirely. On the selloff to Blue Data Point #4, my 13/21RSIs had a bearish cross. Yesterday's gap-filling rally likely would put them at Bearish Synchronicity (it did), meaning that yesterday's low of 22.665 becomes a sell pivot from that particular indicator.

I shorted JOYG at 24.04, after the gap fill, with a stop above the morning gap-filling high of 24.43. I thought about using 25.27 as a stop, the high of the last white candle before the gap down, but didn't want that much risk. A stop out above 24.43 would be a loss of $1,000. The reward would be much better than that if JOYG sold off, and took out the 22.665 low.

JOYG didn't selloff much from my entry, although the general market did have a selloff, and the stock kept coming back in my face. What I really didn't like was...

...Uh-oh...the fact that JOYG was holding up well suggested that this Symmetrical Triangle was going to break out to the upside, which increased the likelihood that I'd get stopped out. Prior to the breakout above 24.11-24.12, which is where the BID and ASK were, I decided to throw it in "at the market." I think that my Buy to Cover order caused the breakout, because I got filled at breakout prices of 24.14 and 24.15 LOL. Loss: $275.

As it turns out, JOYG rallied to 24.545 on the Symmetrical Triangle breakout, so I would have been stopped out for a $1,000 loss instead of the $275 loss, so I felt good about that, but then JOYG sold off and closed at 23.61, so I would have been fine if I had used a higher stop.

"Coulda...shoulda...woulda..."

As far as I'm concerned, though, it's all about risk:reward, and money management. I made a business decision to risk only $1,000 on that trade with a very reasonable stop above the 24.43 gap-filling high, so I don't at all regret that decision.

"Some ya win...some ya lose."

In addition to the morph in the daily chart from a Symmetrical Triangle to a Bear Flag/Rising Channel, I'm wondering if that entire pattern isn't morphing into this possible H&S Top.

FSLR trade.

JOYG trade. Gain on the session: $1,000.

Wednesday, April 22, 2009

IBM, GG And MS


IBM gapped down to the bottom of the channel (in red) in response to its release of earnings. I played it short in both accounts on the rally back to the gap from the prior day's low, with a stop above the prior day's high of 101.19 in one account, and a stop of Monday's 102.04 high in the other account.

After I got stopped out above 101.19, I realized that the stop above 102.04 was ill-conceived. If IBM had the strength to take out the 101.19 high after the initial negative response to earnings, I should have gotten outta there. I abandoned the second half of the trade in the 101.60's, which saved me about $200 since the 102.04 stop eventually got taken out, but it also cost me an additional $450 by not stopping out both shorts above 101.19.

I also realized that shorting IBM, at all, was a mistake. If anything, I should have gotten long the open, with a stop below the channel. I played what I thought IBM was going to do, rather than what it is doing. What IBM "is doing," is still acting bullish, still within the channel, and still with TWO upside targets IN PLAY.

Loss on the two IBM trades: $2,400, which I very much deserved.

My weekend homework on GG paid off (see the 10 "Tells" in Sunday's post, if interested). GG rallied back to the bottom of the broken Ascending Triangle on Monday. Yesterday, it had a "Gap To Crap" opening back inside the pattern, then it fizzled and put in a Bearish Engulfing pattern on the session.

28.08 was horizontal support on Monday. When that got broken after the "Gap To Crap" opening, I shorted GG in both accounts at 28.05 and 28.11-28.12.

There was a gap below from Monday, between 27.39-27.11. I covered my shorts at 27.25 and 27.23, in the middle of that range, wanting to "jockey for position" and reshort it on a rally back toward 28.08 resistance. I didn't get the rally. Gain on the two trades: $4,150.

I shorted Morgan at 24.73 in the Right Shoulder of this possible H&S Top. After I shorted it, I wondered when Morgan was going to report earnings and thought that I'd better check. YIPES. I discovered that they will report this morning! I generally don't like having a position going into earnings, which I view as a "wild card." No matter what Morgan reports, I personally wouldn't believe it, but that's irrelevant. I don't want to get caught short on some RESPONSE to earnings that is favorable, so I covered. After I covered, Morgan broke the 24.37-24.43 neckline of this H&S Top, but closed well above it, at 24.65. Hmmm-mm...we'll see what the RESPONSE to earnings is at the open this morning. Gain: $375.

First batch...

Cover of the IBM and GG shorts.

Gain on the day: $2,125.

Tuesday, April 21, 2009

SPX, SDS And AMZN


From April 15:

"The rally off the March 9 low sure has the look of a Bearish Wolfe Wave."

It was. The target line (#6) came in yesterday at 831.82. The low in the SPX was just above it, at 832.39. The slope of the target line is -1.254, so it will come in today at 830.57, but for all intents and purposes, the target has been MADE, within a half a point. Next objective for The Bears is the bottom of the Wolfe Wave at Blue #2, SPX 814.53.


Off Friday's trendline validation at the bottom of the Bullish Wedge, the SDS gapped higher at the top of the pattern, broke out, and kept pumping to the upside.

As we've seen so often, wedges are notorious for morphing into H&S patterns, or into Ascending/Descending triangles. A Bullish Inverse H&S pattern is a possibility here (pattern in red), and structurally, it would add some strength to the chart. "The bigger the base...the better the breakout." We also often have seen how well "nested" patterns and multiple patterns can perform when they break out, or break down.


I was flat at the open looking for an opportunity on the short side, given the downside gap opening. I wanted the SDS at 66.89 on the 50% retracement of the opening gap, but didn't get it. The low was only 67.17.

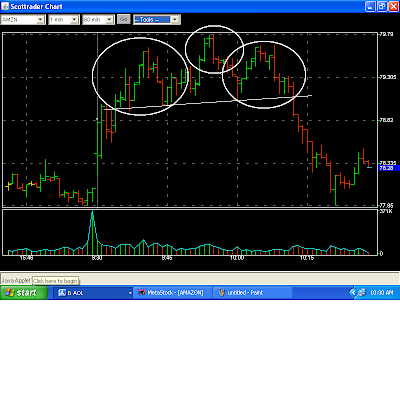
Before the open, Citi upgraded AMZN, and it was called higher while the general market was called lower. I knew that AMZN had just completed a Bearish Wolfe Wave, so I had a quick peep at the chart. AMZN was rallying back to the bottom of the Wolfe Wave, which came in yesterday at 79.39. Since the market was down hard, I entered an order to short it below that, at 79.15, thinking that it might not rally that much.

NO SHARES AVAILABLE TO SHORT at Scottrade again. Grrr-r-r... Fortunately, I was able to short it at TDAmeritrade.

AMZN turned out to be stronger than I expected. It rallied back above the broken Bearish Wolfe Wave, to 79.79, and I thought that I was going to get stopped out above 80.00, the recent high (I was using a mental stop of 80.20, to avoid getting shaken out).

When this little H&S Top showed up and broke down, it put a short-term downside target of 78.34 IN PLAY. Given the early morning strength that AMZN showed, I covered at 78.35 and re-entered an order to short it again at 79.03 on a rally back to the broken neckline of this H&S Top. I didn't get the rally, and the order wasn't filled. AMZN finished down with the rest of the market.

That strategy is what I described to Mark last week in the Comment Section as "jockeying for postion." If I had gotten filled on the re-entry and then got stopped out, the loss on the two trades would have been about $300. On the other hand, if I had gotten filled on a failed retest on the H&S neckline and AMZN sold off again, I stood to gain much more than that. The risk:reward would have been stacked heavily in my favor.

That strategy worked well in my QID trade last week. It didn't work yesterday.

Gain: $800

Monday, April 20, 2009

SPX And SDS


From Friday morning's Comment Section:

"This area would seem like a nice place for a pullback, near the January-February highs of SPX 875-877 in the SPX, eh? The SPX also looks to be forming a Bearish Rising Wedge. We'll see if we get it."

The proverbial "everyone" seems to be looking at the current Bearish Rising Wedge, which always makes me a bit nervous. LOL. Sometimes, though, "everyone" is right, at least for a time, as we'll see in the next chart.

In the current time-frame, this still has the look of a Bearish Wolfe Wave. As I'm sure you've noticed, technicians often draw patterns and trendlines differently, which is their privilege. My view is "use what works." I would have used the high and low of the area that I've circled in blue, but it doesn't work. The trendlines go slicing through the candles that follow and I won't do that because, in my view, that renders any significance of the trendlines useless. If a bar opened or closed on a trendline, violated it slightly, then reversed, I would use it. Otherwise, I can't use "willy nilly" violations of trendlines. That's just my opinion, of course.


Notice the Bearish Rising Wedge (in black) that broke down on January 9. The breakdown put targets of 741.02 (the low of the Rising Wedge) and 688.71 (measured move off the breakdown) IN PLAY. On the way down, we had an intervening Symmetrical Triangle that put a target of 750.64 IN PLAY. All of the targets got MADE, and a bit more. The SPX bottomed at The Evil 666. LOL.

So, "everyone" who played any of that to the downside got it right. But, where "being bearish" went wrong was at the low. "No one" wanted banks. The majority didn't want to play a bear market rally. AAII Sentiment at the March 6 low was at a generational (20-25 years) extreme. Oops!

Market lesson: Bearish sentiment in a bear market is a confirming indicator. Where it becomes a contrary indictor is at extremes, like March 6.

We're now 200 SPX points off the March 6 low, noodling around in this Bearish Rising Wedge. While sentiment is only anectodal evidence and difficult to gauge, does it look like "everyone" is bullish, and that we're going to have a sharp reversal? That's a matter of opinion, of course, but it doesn't at all look like that to me. Early last week, from the floor of The Exchange, Bob Pissonti (sp?) of CNBC said, "Everyone is looking for a pullback. Bears have been getting squeezed with little chance to cover at lower prices. Bulls want lower prices to get in."

I put very little store in anecdotal comments like that, but I ask myself if it sounds like a fair description of what's going on. I thought that it sounded pretty accurate, and we not only didn't give up much last week, we rallied again toward the top of the wedge. So, we'll see how this Bearish Rising Wedge plays out, but I'm keeping in mind that, unlike the January Bearish Rising Wedge, we'll be selling off to breakout support in many stocks and indices in an environment in which both Bulls and Bears alike would be very happy with a good selloff. As I said, that makes me suspicous. Selloff? Sure. HUGE selloff? I'm suspicious, but I'll try to follow the program as best I can ;)

When drawing patterns, I start at a high or a low and label that #1, as I did with the low in this SDS chart (Ultrashort SPX). In this case, the next high is #2. Next low is #3. Next high is #4. We connect the data points with trendlines, and see what happens.

After #4 was in, the SDS broke to a new low. We now can see that the thin trendline where I wrote "No" probably wasn't going to be useful information, even though price at that data point was higher than the high that we labeled #2. Confirmation of that fact was at the down arrow, where the SDS got refused at trendline #2-#4. Ms. Market told us right there, "Yes, that trendline IS resistance." That's called a trendline validation.

Trendline #1-#3 hasn't been validated. Let's see what happens if we start labeling this chart at a high, rather than a low.

We'll put White #1 where we had White #2 in the last chart. Look what happens. Trendline #2-#4 got validated at Friday's lows! Ms. Market told us, "Yes, that IS support." Hmm-m...

Validated trendlines tend to be significant, and "significant" includes Fakeout Breakouts, and Fakeout Breakdowns, so we need to keep that in mind. Sometimes Ms. Market gives us a headfake, breaking out in the "wrong" direction, then reverses in the other direction, so we'll see what she's got in mind.

From Friday's "mini" Double Top in the intraday chart that we discussed at the weekend, we know that we've got SPX 864.56 IN PLAY. In the daily chart, the bottom of the Bearish Rising Wedge, as I have it drawn, comes in at SPX 851.135.