Thursday, March 31, 2011

FCX: Ichimoku Kinko Hyo


Seems that it's been awhile since we've looked at one of these Ichimoku Kinko Hyo charts ("At A Glance...The Table Of Balance"). I very much like the visual representation of the Bull vs. Bear struggle, and they are particularly helpful to those who want to catch an intermediate to longer-term move in a stock, a number of which we can see quite clearly. A little pattern identification thrown in also is helpful.

For example, look at the two bullish patterns that emerged last summer, prior to the sizeable rally in FCX. The Bullish Falling Wedge, in blue, gave FCX a boost back above the Kumo, which means Cloud, represented by the vertical lines. Purple Data Point #4 of the Bull Flag, in purple, was a tag of the top of the Kumo. When FCX found support there, the bounce off that support, and the subsequent breakout of the pattern launched a beautiful rally.


In my experience with looking at these Ichimoku Kinko charts, I find that after a bearish phase, when a stock is trying make a trend change and turn the corner higher above the Kumo (Cloud, the first attempt or two quite often fails. If the stock can find support at the bottom of the Kumo (Cloud), then move higher again, that's "constructively bullish." If the stock can then CLOSE above the Kumo (Cloud), that's "usually" a good sign. Naturally, the stock needs to stay above the Kumo (Cloud) and continue to move higher, above the Kumo. A "foot fault" or two, back inside the Kumo during the time that a stock is experiencing a transition phase to bullish is fine, or even a little backing and filling inside the Kumo, but we really don't want to see the stock close back below the bottom of the Kumo.

In the current time-frame, notice how on its first two attempts to get through the Kumo, FCX failed and pulled back. FCX found support at the bottom of the Kumo, which also happened to be the neckline of the Bullish Inverse H&S pattern, then it made another bid to break out of the top of the Kumo.

The backing and forthing and general head-knocking between the Bulls and Bears during this transitional phase is to be expected. Bulls and Bears are "duking it out" for control of the Kumo. Above it is Bull Territory. Below it is Bear Territory. The Bears have been in control recently, and they ain't "giving it up" without a good fight.

The March 31 close is the first close above the Kumo since the January breakdown of the Double Top, so at the moment, FCX is in Bull Territory and The Bears are NOT happy about that. The Bears know that they shouldn't have allowed The Bulls to score, and they're doing some serious "talking smack" down in the locker room. I can't repeat what they're saying, in case ladies are present.

Anything back inside the Kumo augurs more head-knocking until one team or the other can take FCX into their territory.

Since I have an open position long 500 shares of FCX @54.53, I can't say which team that I'm cheering for, or I might appear to be biased ;)

ARIA, MON And JOYG: Gravestone Dojis


Although ARIA was able to reverse the bearish implications of the March 25 Gravestone Doji by putting in an Ascending Triangle, and then breaking out above the 7.30 highs of that pattern (best seen in the intraday chart that I posted yesterday), putting a target of 7.65 IN PLAY, that was unusual. The Gravestone Doji more often forebodes some significant downside, a couple of examples of which we'll see below.


Monsanto (MON) took a significant beating in the first half of 2010. It rallied mid-summer, went into a Falling Channel, then broke out to the upside. MON moved along to the upside, then "Ye Dreaded Gravestone Doji" showed up, after a gap higher.

CAUTION...CAUTION...CAUTION...


Pfff-ff-ft...


Nice rally of about 50% in Joy Global off its February, 2010 low. JOYG rallied right through the Rectangle resistance, almost as though it weren't even there. The rally wasn't quite parabolic, but nearly so. There wasn't much backing and filling/base building, to establish solid support.

"Gee, I wonder where this rally is going to end!" Well-ll, we never can know that for sure until it unfolds, but when "Ye Olde Gravestone Doji" shows up after a nearly parabolic rally, it might be a good idea to take at least something off the table.

Remember "The Parabolic Rally...Parabolic Return" that we recently looked at in AMZN?


As I said, the rally wasn't quite parabolic, but the net effect of the selloff was the same as "....Parabolic Return." There was little support established on the way up to stem the tide of the selloff on the way down. The bulk of the selloff took MUCH less time than MON spent going up, which is fairly typical when stocks haven't done any nice base-building.

I think that it has to do with Newton's Law (3rd?) of Thermodynamics that is something like, "For every action, there's an equal and opposite reaction." I got a "D" in Physics, though, so don't hold me to that ;)

Wednesday, March 30, 2011

FCX: Hourly Head And Shoulders Top


TRADE #1:

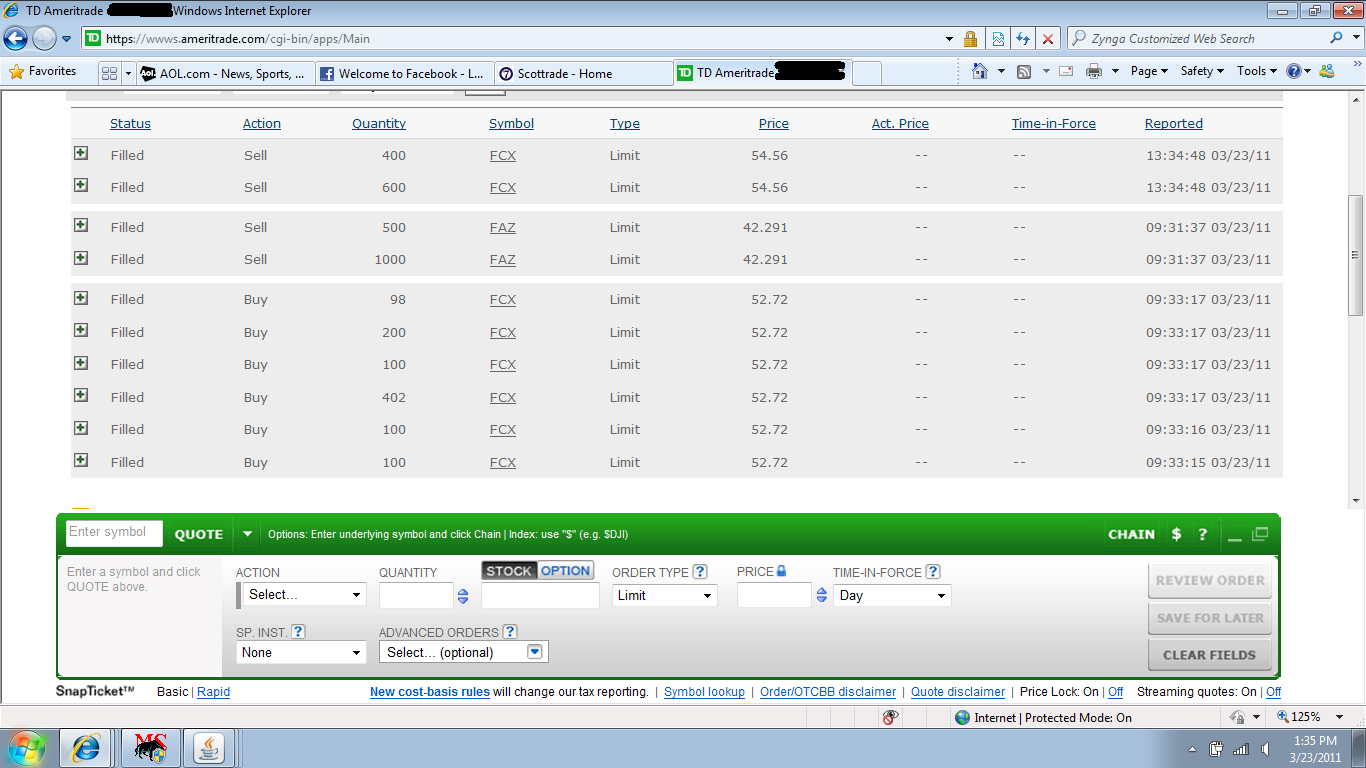
Due to the rather sizeable overhang of sellers who have been trapped at higher prices since the two pattern breakdowns this winter, and especially due to the fact that FCX was indicated at BID: 55.10...ASK: 55.14, very near the Nested Descending Triangle target of 55.19 that would go IN PLAY on the technical breakout of that pattern, FCX looked to be slated for a "Gap And Crap" open, which means that the stock gaps higher, then fizzles.

I sold my 500 shares that I purchased for 54.58 on March 28 at the open, AT THE MARKET. I got filled at 55.10, then immediately placed an order to repurchase those shares at 54.53, near the top of the Descending Triangle, figuring that FCX was in for a retest of that breakout, at a minimum, and quite posssibly a complete fill of the opening gap. I was willing to "pay up" at the Descending Triangle, even if FCX went lower, which it did. The stock has been acting very well, and this trade allowed me to jockey for a better position.

Gain: $250.


A "nested" pattern means that there's another pattern, or patterns, "nested" within a larger pattern. In this case, we had a Smmetrical Triangle (the pattern in yellow), "nested" within a Descending Triangle (the pattern in white). Many TA textbooks will tell you that Descending Triangles ARE bearish. No, they aren't. The majority of them are, especially in a downtrend, but we can see that this one wasn't.

The lows of the pattern were perfectly flat, at 53.84 and 53.84. Subtracted from the high of the pattern, which was 54.54, gives us 0.70 points of upside on a breakout above the top of the pattern. The top of the pattern was at roughly 54.49 at the opening gong when FCX gapped higher, so that gave us 54.49 + 0.70 = Target: 55.19 IN PLAY. FCX opened at 55.14, then immediately fizzled.

As we've seen so many times in the past, "nested" pattern breakouts can be very powerful, even explosive. FCX exploded at the open to 55.14, the high of the morning, then fizzled. Although the 55.19 target got MADE later in the session, if I had insisted on selling my shares at a limit of 55.19, I would have missed the opportunity to sell and reposition at a lower price.

Market Lesson: Targets only are "what we're aiming for," and what a given pattern measurement suggests. We don't want to step over dollars to pick up a few extra pennies. If we're close to a target on a gap, or at the end of a trading session, TAKE THE MONEY!!

Trade #2:

In my other account, I bought FCX when the morning gap was filled entirely. My mental stop was 54.84, the lows of the Decending Triangle. As we discussed recently, I'll allow for a little "shakeout" below my stop for a penny or three, but not a lot more than that. On a "shakeout," the stock should recover fairly quickly.

A "shakeout" is exactly what I got. FCX printed a low of 53.825 (first white arrow), a penny below my mental stop, then quickly bounced off that. My trading thesis for buying the gap fill was that FCX would bounce from somewhere near there and probably wouldn't test the 53.84 lows at all, let alone break them. That obviously didn't work out, so I changed my trading plan to: (1) Get out at roughly break even, if I could (2) DEFINTELY sell for a loss of about $1,300 if the "shakeout low" of 53.825 got taken out.

As FCX rallied back toward Unchanged, I had my order filled out and my hand firmly on the "sell buzzer." LOL. I was able to get out AT THE MARKET with a small gain (sold at the red arrow). When we want out, we don't want to fool around with limit orders. Sell!!!

Gain: $150

Trade #3

After I sold, the rally back to Unchanged failed, and "shakeout low" of 53.825 got taken out. If I hadn't sold, I would have had to take the loss of about $1,300 and as it turns out, I would have been "shaken out" for a pretty good loss (second white arrow), because 53.76 was the low on the session. As we can see now, those lows sure were "shakeouts (Bear Traps),) but we can't know that at the time they occur, so we wait and watch, and see what unfolds.


Trade #3:

Off the second Bear Trap/"shakeout" low, FCX rallied back to 54.43 exactly, which was the Reflex Rally high off the first Bear Trap/"shakeout" low. Hmmm...that set up a move to a "higher high," above 54.43, which would be constructively bullish again.

FCX broke out above 54.43, put in a little Symmetrical Triangle, broke out above that, then pulled back a little. That was TWO bullish moves in the stock, and very compelling for another entry long, now that I could see that TWO Bear Traps had been sprung, so I bought it again, for 54.54. That was a higher price than that for which I sold it earlier, but that's immaterial. We can't be afraid to pay a higher price, as long we have good evidence that we ought to take a position, and I certainly did at this point. My stop was below the minor low of 54.30, which was the low after the 54.43...54.43 trendline was established, so not much risk if I were to be stopped out.

FCX rallied smartly right after I bought it. I "sold into strength" for a gain of $1,000.


Gain on the 3 trades today: $1,400.
Gain on the 9 closed FCX trades since March 23: $7,550.

I have an open positon of 500 shares, repurchased this morning for 54.53.
Current gain on paper: $350.


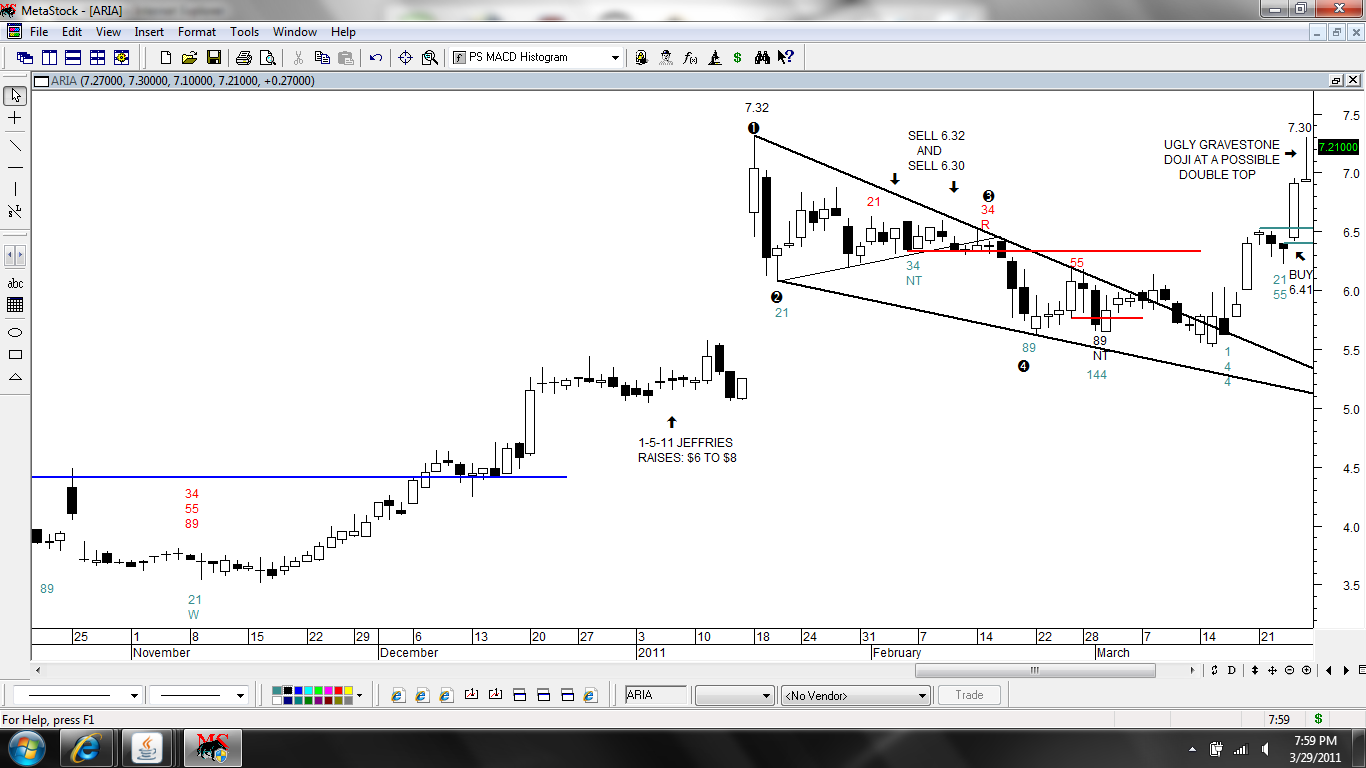
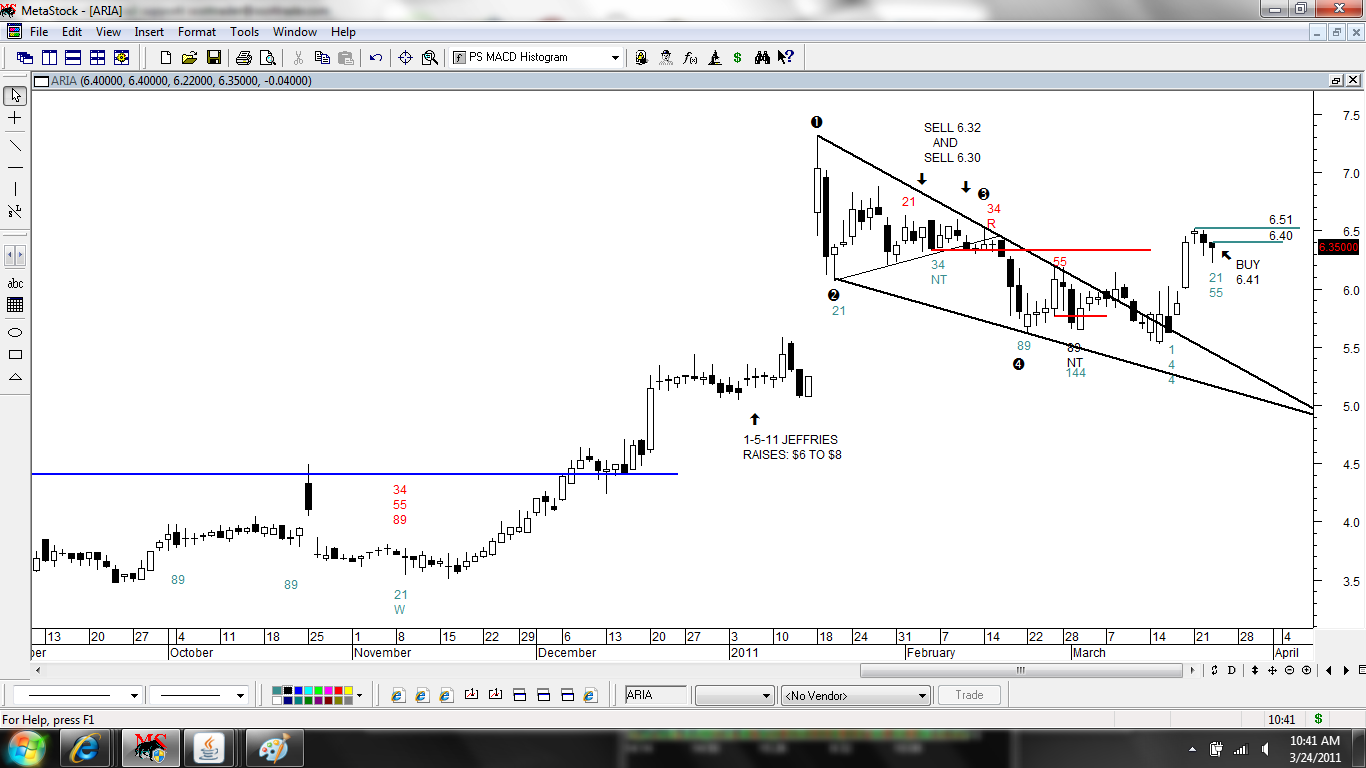
NOTE: Notice that a Bull Flag (pattern in yellow) is "nested" within the Right Shoulder.

When FCX sold off to only 54.45 on Tuesday, I was disappointed that it didn't go down and successfully retest the neckline of the Bullish Inverse H&S breakout (pattern in white), and was doubly disappointed to see that it set up a near-perfectly flat neckline (horizontal red line) of a possible Bearish Head & Shoulders Top. The prior retest low was 54.44, so the putative neckline is 54.44 and 54.45.

This putative H&S Top isn't nearly as broad as the Bullish Inverse H&S pattern, but it's there nonetheless. The Bears obviously would like to break the neckline, and then also break the neckline of the Bullish Inverse H&S pattern. If The Bears can succeed in doing that on a CLOSING basis, that would call any near-term bullishness into serious question.

What militates against The Bears being successful are a number of factors:

(1) FCX has had TWO bullish pattern breakouts in the Daily Chart, which trumps the Hourly Chart. Patterns in longer-time frames tend to hold more weight and have more significance.

(2) Beginning with the Fakeout Low of 46.10 a few weeks ago, Ms. Market continues to pull off Bear Traps, like the two that we witnessed today. Today's opening "Gap And Crap" gambit was a Bull Trap because the rally fizzled and took out the Descending Triangle low, but as of today's 55.24 close, Bulls who bought the 55.14 aren't trapped any more. It is the Bears who shorted that opening, or anything below it, who are trapped as of today's close.

(3) In a H&S Top, the high of the Left Shoulder should NOT be taken out to the upside during the formation of the Right Shoulder. There should be a diminution of buying interest in its formation, prior to a tank below the neckline. The high of this putative Left Shoudler is 55.25. That got taken out to the upside going into the closing gong. FCX put in a high of 55.31, so that's another one of those "shots across the bow" from The Bulls.

If The Bulls can take out the 55.65 high of this putative H&S Top, that would negate the bearishness of the pattern, and The Bulls would have another upside target IN PLAY (the height of the pattern, added to the takeout of 55.65). If that were to occur, it wouldn't mean that this wasn't a putative H&S Top.

It would mean that it was a Head And Shoulders Top that failed to materialize.

ARIA: "A Good Dinner" Money

(Click on charts to enlarge, then click on them again for further enlargement. Use left arrow at the top of your browser to return to the narrative).

From March 25:

"Not getting my order filled on the 5,000 shares became even more disappointing when I saw that ARIA closed at 6.91, which would have been a $2,400 gain from my entry at 6.43. It's frustrating to do our homework and not get paid for it, but we won't let our emotions get hold of us, will we? Curses!!! LOL."


Getting over a disappointment like that one has been difficult for me as a trader because I work so hard, and I know that I earned the trading profits that I didn't get. It's very important to get over the disappointment as quickly as possible, though, because the negative energy really affects our attitudes and can cloud our thinking. "Getting over it," however, doesn't mean that have to forget the stock and all of the work that we've done. We can continue to watch it and take advantage of any opportunity that presents itself.

On Friday, March 25, ARIA put in a Gravestone Doji, which "usually" signifies at least a short-term reversal. Intraday, the stock ran up toward the 7.32 high, but fizzled into the close. You probably could hear the air come out of it. "Pff-fft!"

On Monday, March 28, I was looking for a black candlestick that CLOSED at least 50% below the close of the big white candle of Thursday, March 24. That would complete a 3-Day Bearish Evening Star pattern, which is one of the most bearish reversal patterns in the candlesticks, if not THE most bearish. This is what I got...


Huh? ARIA went back up to Friday's 7.30 high??? That isn't at all what I expected, but we know always to "expect the unexpected" from Ms. Market. That print of 7.30 again in Monday's trading meant that ARIA wasn't "giving up the ghost" on that Gravestone Doji, and how many other players weren't expecting that, because it was unusual? Hmmm-mm....

I certainly didn't expect to be thinking about BUYING at these levels, after the recent run-up, but what would be "likely" to happen if ARIA took out the 7.30 highs of Friday and Monday, AND took at the 7.32 high, as well? Hmmm-mm...

For one thing, we know that The Bears who shorted that Gravestone Doji, or anywhere below that, would be in a pickle on a move to new highs, so they would have to BUY TO COVER if ARIA broke out, and for another thing, we know that a lot of players love to BUY breakouts. Hmmm-mm....

Sounds like Ye Olde "Buying begets Buying" might come into play.


When ARIA was champing at the bit for a breakout, at BID: 7.28...ASK 7.29 yesterday morning, I had to laugh at myself as I was furiously filling out my order form, knowing that I was about to buy a stock that I thought I'd be shorting. Ms. Market sure can make us feel foolish.

I wasn't about to go in again with a limit order on 5,000 shares because those buzzard faces probably wouldn't fill me again. Instead, I went in with only 2,500 shares AT THE MARKET. I figured that they wouldn't allow me to have it for the 7.29 ASK, either, which was fine with me in this particular case, because if my order pushed ARIA higher, all the better. They filled me at 7.30, then ARIA broke out at 7.31 in a matter of seconds.

The 7.31 breakout put an upside target of 7.65 IN PLAY, derived by subtracting the 6.95 low of the Ascending Triangle from the 7.30 highs (0.35 points of upside), then adding that 0.35 points of upside to the 7.30 breakout.

ARIA came back below that breakout and traded there for awhile, but I wasn't about to give up my position unless they could knock out my stop, which was below White #4 in the Ascending Triangle. ARIA came on again in the late afternoon, printed new highs on the session in the homestretch, and simply ran out of time at the wire. 50% of the 7.65 target had gotten MADE and I was content with that, so I cashed it in and thanked Ms. Market for "a good dinner" money (I've upgraded from having to accept "lunch money" in my ARIA trades).


Gain: $425. It isn't the $2,400 that I deserved last week, so ARIA still owes me $1,975. LOL.

Kidding aside, this isn't much of a profit, but it's such a great example of what I mean when I say, "Don't try to predict the market...FOLLOW what Ms. Market is telling you, as best you can." There's no question that I would have "predicted" that the Gravestone Doji would have resulted in pretty good move to the downside early this week, and I would have been completely wrong.

>>>>>> Enter The Munchkins, singing "FOLLOW....FOLLOW....FOLLOW...."

Tuesday, March 29, 2011

FCX And SCCO


(Click on charts to enlarge, then click on them again for better viewing. Use left arrow at the top of your browser to return to the narrative)

From pre-market comments yesterday:

" The high of the third trendline validation was 54.84, so The Bulls want to take that out to the upside. That would put the recent high of 55.25 IN PLAY, as well as a measured move of about 55.58 IN PLAY."

Both of those Bull Flag targets got MADE yesterday morning, but not without Ms. Market acting positively evil first, as is her wont ;)

FCX gapped higher at the open for the Bull Flag breakout, then came all-ll the way back and filled the opening gap AND took out the low of the Bull Flag by just two pennies (red arrow)! That's another one of those "shakeouts," which are so annoying, but FCX then reversed off the bottom of the flag, and the targets got MADE. Whew!

Later in the session, FCX put in a Double Bottom in the 54.70's (horizontal orange line), but that failed and the retest of the breakdown also failed (orange arrows). That was followed by an attempt to break out of a Falling Wedge (pattern in yellow), but that also failed (lower yellow arrow), and down she went into the close. THUD.


"Take profits, or at least 'some' profits, when targets get MADE." In this particular case, due the fact that FCX has enjoyed a nice rally of 20% in under three weeks, and that it was trading in the zone of the sizeable "overhead supply" that we discussed yesterday, I sold all of my shares that I purchased on Friday for 54.45 when the 55.25 Bull Flag got MADE, and...


... I also sold all my shares that I purchased on March 24 for 53.95 when the second Bull Flag target of 55.58 got MADE.

Gain on the session: $2,400. Gain on the six closed trades since March 23: $6,150.

The Bullish Inverse H&S target of 60.42 in the daily chart still in IN PLAY, so during the afternoon selloff, I bought back 500 shares of the shares that I sold in this account in the morning, just to keep my hand in the game. I paid 54.58 for them, which was a one dollar discount to the price for which I sold them. I'm willing to give back some of my nice gains as a sacrifice to the market gawds since FCX still is above the Inverse H&S breakout, but I intend to hang onto a good chunk of those gains ;)

I'm now long 500 shares of FCX from 54.58 with a paper loss of $250.

In addition the sizeable overhang of supply that we've got in FCX, another factor in deciding to curb my enthusiasm about repurchasing any more than 500 of my shares is the chart of sector-related Southern Copper Corportation (SCCO).


YUK!

Sector-related stocks don't necessarily trade in tandem with each other, as evidenced by the fact that FCX is a much better looking chart than this one, but they often do "trade in sympathy" with each other, at least for a short while.

As we can see, (1) SSCO has completed a H&S Top, (2) failed TWO retests of the broken neckline, at Yellow #2 and Yellow #4, during the formation of an Ascending Triangle (the pattern in yellow), (#3) broke down below the Ascending Triangle, and (4) when I took this screen shot around 1:30PM yesterday afternoon, SCCO was threatening to break down out of the Bearish Rising Wedge (pattern in red). Perfectly dreadful looking!

I was of half a mind to short SCCO right here when I took this screenshot, but that didn't seem very sporting of me since FCX has been so good to me on the long side in recent sessions. LOL. SCCO finished the session with a breakdown below the Bearish Rising Wedge and it fell fifty cents from this screen shot into the final gong, so shorting 1,000 shares of it "would have been" a nice little gain of $500.

MARKET LESSON #1: Between the opening and closing gongs, steel yourself to your own emotions and to any thoughts you have about what you "think" Ms. Market should do, and to what you would "like" Ms. Market to do. Ms. Market Rules! If you don't FOLLOW what she is telling you, like these THREE Bearish Pattern breakdowns, you will NOT pass go and you will NOT collect the $500.

MARKET LESSON #2: Stop making jokes about it, Melf Elf, you moron. You're not funny.


Since the neckline of the Bullish Inverse H&S has a downward slope of a penny and a half, we "move the chains" by that amount each session, so it comes in today, March 29, at 53.185. Important support (or resistance) often gets violated by a penny or three (sometimes a little more), as we witnessed when Ms. Market took out the Bull Flag low yesterday morning, by two pennies (red arrow in the first chart). Those are known as "shakeouts," which are devious attempts to talk us out of a good position. Anyone who used Friday's 54.39 low as a "hard stop" got shaken out when Ms. Market took FCX down to 54.37, then rallied it to the 55.58 Bull Flag target. UGH. If one were shaken out at 54.37, one might be inclined to say something worse, like "Curses!!!"

If, for example, FCX has a fast selloff one morning, violates the neckline, but then bangs higher, that's fine, at least for the time being. For another example, look at the March 23 candle, which was the 51.21 low of the Right Shoulder of the Bullish Inverse H&S pattern. That candle also was a SECOND successful retest of the Bullish Falling Wedge trendline. FCX banged right off there, then put in a Bullish Doji Star Hammer. That was very, very nice.

When we're long a stock, we never enjoy seeing it go down, but if the Bullish Inverse H&S target of 60.42 is going to get MADE, a successful retest of the neckline certainly would be very helpful, as would be ANY trendline validation, like the two failures to regain the broken neckline at Yellow #2 and Yellow #4 in the SCCO chart. Ms. Market told us, "Yes, I've told you TWICE now that the broken neckline IS validated resistance. What else do ya wanna know?" LOL.

Monday, March 28, 2011

FCX: Consolidation Patterns


(Click on charts to enlarge, then click again for further enlargement. Use back arrow at the top of your browser to return to the narrative).

There's an explanation of overhead supply written on the chart, for easier reading, as well as the numbers for key support areas.


After a short-term rally of roughly 8% (the red arrow) and a rally of nearly 20% off the 46.20 March 10 low, I like seeing this period of consolidation, otherwise the stock is in danger of a parabolic blowoff, meaning that it goes straight up without building any kind of chart structure. Those often result in Ye Olde "Parabolic Blowoff...Parabolic Return" to the origin of the rally, and often below that, as witnessed recently in AMZN (see chart below).

Basis this 10-Minute chart, The Bulls attempted to break out of a Symmetrical Triangle (the thin white line was the bottom of that pattern), but The Bears were able to break it to the downside heading into the closing bell. The Bulls would like to "morph," or change, that broken Symmetrical Triangle into a Bull Flag, having established White Data Point #4 on a Bullish Hammer in the final candle of the session.

The three white arrows at the top of the pattern are trendline validations. Ms. Market told us quite clearly, "YES! That IS resistance!" When validated trendlines get taken out, that usually has "some" significance. The high of the third trendline validation was 54.84, so The Bulls want to take that out to the upside. That would put the recent high of 55.25 IN PLAY, as well as a measured move of about 55.58 IN PLAY.

Math:

55.18 - high of the pattern
54.39 - low of the pattern

55.18 - 54.39 = 0.79 points of upside added to a breakout near 54.79 = roughly 55.58 IN PLAY (depends where it breaks out, if it does).

FCX currently is indicated to open down a bit, at BID: 54.50...ASK: 54.51


Example of a "Parabolic Rally...Parabolic Return."

Saturday, March 26, 2011

FCX: The Inverse H&S Breakout


(Click on charts to enlarge, then click on them again for further enlargement. Use back arrow to return to narrative).

I "sold into strength," at 54.90, one of my positions in FCX on the early morning rally to anticipated resistance at the top of this triangle. FCX rallied to a high of 55.18 then traded sideways-to-down for the remainder of the session. Gain: $700.


I bought those shares back at the end of the day for 54.45, and I'm still holding the shares in my other account that I bought on March 24, for 53.95. I've now got a gain of about $3,600 on the four closed trades this week in FCX.


I like the fact that FCX is consolidating here, above the neckline breakout.


As I've mentioned a number of times in the past, Bullish Falling Wedges (pattern in black) are my LEAST favorite bullish patterns because when they breakout, they have a lot of resistance from the "falling" candlesticks that preceded the breakout. I like them much better when they rally to form a neckline, then "morph," or change, into a Bullish Inverse Head & Shoulders pattern, as FCX has done (the pattern in green). That gives the chart a more solid structure from which to launch a better rally.

The upside target for the Bullish Inverse H&S breakout is derived by subracting the low of the pattern (46.20) from where the neckline was (53.38) when that low got put in, then adding that amount to where the pattern broke out to the upside, which was 53.24.

53.38 - 46.20 = 7.18 points of upside, added to the 53.24 breakout point, gives us a target of 60.42 IN PLAY, as long as FCX trades above the neckline breakout. If FCX trades below the neckline, that's one of those "knuckle-biters," like we saw in ARIA after it broke out of its Bullish Falling Wedge. ARIA had a very sloppy breakout, whipsawing above and below its Bullish Falling Wedge upper trendline, then it took off to the upside.

The ETA (estimated time of arrival) for the FCX target of 60.42 that is IN PLAY is by Easter Monday, April 25, which simply is the same number of days from the breakout (March 23) that it took for the Bullish Inverse H&S pattern to form. That's just a guideline that I like to use. If FCX hasn't traded somewhere near that target by Easter Monday, I have to question how sincere it was about the bullish breakout ;)

Targets aren't any sort of guarantee, either. They simply are "what we're aiming for" based on what the pattern measurement suggests. A lot can happen between a breakout (or a breakdown) and the anticipated target getting MADE.

Friday, March 25, 2011

ARIA And FCX


(Click on charts to enlarge, then click on them again for further enlargement. Use the back arrow at the top of your browser to return to the narrative).

Similar to how appealing FCX looked at Wednesday's open when it was indicated to open higher, Ariad Pharmaceuticals (ARIA) was indicated to open higher yesterday at about 6.45, five cents above Wednesday's high of 6.40. My 21 & 55 Fibonacci measures of Relative Strength would issue a Buy Signal on any trade above that 6.40 high.

ARIA had a "sloppy breakout" of the Falling Wedge (pattern in blue), but after two nice white candlesticks, it had three down sessions and, at yesterday's gap up opening, looked poised to go higher.


I placed my order for 5,000 shares at 6.43, anticipating that ARIA would pull back a little to fill the gap from Wednesday's 6.40 close. It did. It pulled back to 6.42, but as you can see from this screen capture, the rotten buzzards only let me have a lousy 289 shares. That's a problem with playing a low-priced stock in size (large order). It can be difficult getting the order filled, as it was for me yesterday.

What am I going to do with a lousy 289 shares of a $6 stock? It isn't worth the distraction to play it, so I sold it for lunch money, at 6.59.

NOTE: The FCX trade reported here was a quick trade that I made on its early morning selloff.


Not getting my order filled on the 5,000 shares became even more disappointing when I saw that ARIA closed at 6.91, which would have been a $2,400 gain from my entry at 6.43. It's frustrating to do our homework and not get paid for it, but we won't let our emotions get hold of us, will we? Curses!!! LOL.


Here's the morning selloff in FCX, which was a retest of the neckline of the Bullish Inverse Head & Shoulders pattern. Retests of breakouts are common, and are to be expected. If the retest is successful, that's validation of the breakout. So far, that retest looks fine (white arrow).

Sometimes, stocks go back below the breakout, as ARIA did after it broke out of its Falling Wedge in the first chart. When that occurs, it's a "knuckle-biter," leaving you wondering if it's valid. Those "sloppy breakouts" are difficult and have to be handled on a case by case basis.


I bought back the 1,000 shares that I sold for 54.56 on Wednesday.


The horizontal red line is where I initally sold FCX yesterday. I expected some resistance there, so I sold at 54.54 and took a $700 gain, then...


...bought those shares back at 54.18.

Thursday, March 24, 2011

BIDU, FCX And FAZ


(Click on charts to enlarge, then click on them again for further enlargement. Use back arrow at the top of your browser to return to the narrative).

BIDU sold off a dollar in the early going yesterday morning, then turned Tuesday's upside technical breakout of the rising channel into a rally to new highs. Did I mention "excellent relative strength" yesterday? LOL. No doubt, the rally was fueled in part by The Bears continuing to short this stock, "hoping" that it would play catch-up with the Nasdaq on the downside. UGH.

While breakouts and breakdowns do sometimes end up being fakeouts, I find that it's best not to argue with Ms. Market and to try to follow instructions. Unless we see evidence of a fakeout: "Don't short upside technical breakouts, and don't buy technical breakdowns."


Pre-market yesterday morning, Freeport McMoran Copper & Gold (FCX) was called to gap higher, at 53.00. I hadn't looked at it for a few days, so I quickly opened the chart to take a look at it, and this chart is what I saw.

FCX had broken out of this big Falling Wedge, had successfully retested the trendline in Tuesday's trading on a Bullish Doji Star Hammer, and my 21/34 Fibonacci Relative Strength Indicator (the Green "21" under yesterday's candle) was about to issue a Buy Signal on any trade above 52.68, which was Tuesday's high.

And, it was called to open at 53.00??? Oh-h-h, buddy! I was licking my chops like my little doggy boy pictured in my avatar ;)

My only decision when I saw that opening indication was "where" I would buy it, not "if" I would buy it. Since the indcated price was below last Friday's breakout high of 53.29, I decided not to pay the opening price of 53.00, and to take the chance that there would be a quick selloff toward the gap that would be left
on the chart from Tuesday's high of 52.68. That strategy worked out fine. I bought FCX in both of my accounts in the 52.70's, slightly above the gap high of 52.65.


As we've seen so many times in the past, Falling Wedges often "morph," or change, into a Bullish Inverse Head & Shoulders patterns. It's difficult to see it on the daily chart, which is why it's very helpful to look at intraday charts, like this hourly chart, in which the pattern is much clearer.


After a couple of pullbacks early in the session, which ended up filling the opening gap in the daily chart entirely, FCX put in this strong white candlestick on the session.


I took a quick gain of $500 in one account, and raised my mental "stop loss" to a break even in my other account to lock in a winner.


I took a larger gain in the other account later yesterday afternoon. Since my FAZ sale also is listed here...


...I purchased it on Tuesday, in anticipation of an upside breakout of an Ascending Triangle, seen in the chart below.


FAZ gapped higher at the open and immediately made a run for my initial target, which was the recent highs represented by the horizontal red line. I "sold into strength" with the idea of repurchasing it if it pulled back and consolidated the early gains. My next upside target was the gap above.


No pullback in the early going. FAZ ran directly to the gap (the horizontal yellow line), which was my second upside target. The gap got filled within just a few pennies, then FAZ sold off for the remainder of the session. Notice that after the gap fill, FAZ tried to find support at the horizontal red line, the previous highs (see red arrow). That failed, and FAZ gave up all of the session gains, but did find support near the top of the Ascending Triangle (white arrow). That's "constructively bullish," but I wanted to hang onto my gain and wasn't interested in holding FAZ over night.

Gain on the session: $3,550.

Wednesday, March 23, 2011

BIDU - Excellent Relative Strength


(Click On Charts To Enlarge)

This is the daily chart of BIDU that we looked at coming into this week, with the trendline data points for the top and bottom of the channel noted.


After breaking out of the white downward sloping channel to the upside on Monday, and forming the pattern in yellow by Monday's close, BIDU rocketed to almost 127.00 at yesterday's open (yellow arrow). That took BIDU above the channel in the daily chart that we just looked at.

BIDU then gave back all of the day's gains, filled the morning gap at White #2 of what became a Symmetrical Triangle, then formed and broke out of the little patterns in red and orange.


I made a play in BIDU after the morning gap was filled, and it began to rally. Gain: $2,500.


BIDU's 127.09 close is a breakout above the channel in the daily chart, and it also is a complete fill of the 125.71 - 126.80 gap from February 18, represented by the two horizontal dotted red lines. BIDU has been showing excellent relative strength basis the NASDAQ Composite Index, which still is well below its February 18 high.

The Bears have gotten squeezed badly and would very much like to turn yesterday's close into a false breakout.

Tuesday, March 22, 2011

BIDU: Channel Breakout


This chart is a great example of the importance of trendline validations. After we connect the first two data points for our trendlines (both upper and lower trendlines), we want to see if Ms. Market will validate that they are significant, either by finding resistance or support when they get tested. The circled numbers are trendline validations both of resistance (#3 at the top of the channel) and of support (#3, #4 and #5 at the bottom of the channel).

When a validated trendline gets broken, that usually has some significance. Not always. Sometimes the breakout fails, and the stock goes back into the channel. There's no "always" in the stock market.

In this particular case, when BIDU broke out of the channel to the upside just after yesterday's open (white arrow), it got a nice little pop and now looks to be trying to form another pattern (the one in yellow).

Sunday, March 20, 2011

AAPL - Beware The Ides Of March


(Click on charts to enlarge, then click on them again for further enlargement. Use back arrow to return to blog).

This chart is late 2010, which some explanations of the patterns and targets, for learning purposes.


This chart is the current time-frame, with notes on the recent breakdown.


Just an example of what to watch for, if AAPL were to have a more serious breakdown.