Friday, May 30, 2008

VPHM: Channel Breakout


(Click On Chart To Enlarge)

From May 16:

"At yesterday's close, VPHM is back at the top of the channel, which comes in today, May 16, at 9.231, so a print of 9.24, which also was yesterday's high, is a technical breakout of the channel. We'd want to see 9.25 get printed, to take out yesterday's high."

No breakout on May 16. The high was 9.24, validating the top of the channel as resistance (Purple #5). Since May 16:

1. The 50DMA made a Bullish Cross above the 200DMA on May 19.
2. Breakout above the top of the channel on a closing basis (9.05) on May 27.
3. Successful retest of the top of the channel at the 8.98 low on May 28.
4. 9.24 validated resistance was taken out on a closing basis (9.28) on May 29.

Friday, May 23, 2008

UYG - The Three Bears


(Click On Charts To Enlarge)

After completing the Bearish Wolfe Wave, which also resulted in a breakdown of the Bearish Rising Wedge (see blog entires from early May), UYG chased the bottom of the broken Bearish Rising Wedge, forming a THIRD bearish pattern, a Bear Flag (highlighted in Chart #2). The target of 30.54 was MADE and exceeeded, and UYG rallied yesterday off a short-term oversold condition.

Near-term resistance on the upside is the bottom of the Bear Flag, at 31.46, then the 32.02 - 32.49 gap from the Bear Flag breakdown.

Thursday, May 22, 2008

NASDAQ - Bearish Wolfe Wave


(Click On Chart To Enlarge)

From May 17th comments:

"The NASDAQ printed 2537.41 on Friday, just below the November 26, 2007 low of 2539.81, and right at the 2538 target."

That target was MADE at Wave 3 of a Bearish Wolfe Wave in the Hourly chart. The NASDAQ had one more rally in it after that, the Wave 5 upside Fakeout/Breakout to put players wrong-footed, then it plunged very quickly (a hallmark of a good Wolfe Wave) and reached the Wave 6 target line in late afternoon trading yesterday. Note the nice symmetry of time between Waves 1 and 3, and Waves 2 and 4.

Wednesday, May 21, 2008

CHL: Symmetrical Triangle Target


(Click On Chart To Enlarge)

Review:

"Chart #4: CHL closed on May 6 at 88.33, looking like it wanted to break out the Symmetrical Triangle (purple) to the upside for a bullish continuation, but it was called lower at the open yesterday, and opened at 85.87, BELOW the pattern, and BELOW Data Point #4 (purple) of the pattern, which was 86.06.

81.76 is IN PLAY."

The Symmetrical Triangle target of 81.76 MADE in yesterday's trading.

QXM: Ahead Of Earnings


(Click On Charts To Enlarge)

QXM broke out of the Purple Wedge (Chart #1) ahead of April 21 earnings and was beautifully positioned to go higher. When earnings were released, "Cowen and Co. analyst Matthew Hoffman called revenue a "little light," but overall he said the company's earnings per share handily beat expectations."

"Handily beat expectations" sounds good, but QXM was called Gap Down after the release of earnings, which usually is an indication of "That's just for openers. The stock is going lower." One of the reasons for the Gap Down is that Matthew Hoffman also said, "The tardiness of the 4Q07 results highlights an ongoing concern, but the company does continue to make overall progress on disclosure," Hoffman wrote.

The ongoing concern about the tardiness of results has plagued both QXM and XING, and the comment about the company making progress on disclosure was as meaningless to the market as Stanley Ng's similar comment about XING because the REACTION in the market to both comments was to sell the stocks, and the "handily beat expectations" was ignored.

Lesson: Watch the market's REACTION to earnings reports.

Ahead of April earnings, QXM closed at 7.69. After tanking on earnings, the stock recovered and filled the 7.69 gap, printing 7.70 on May 16, prior to the news about the $70 million in convertible notes. After closing on May 16 at 7.52, QXM gapped up on Monday, May 19 to 7.68, printed a high of 7.69, then sold off.

So, technically, the RESPONSE to the fundamentals since the April 18 close has been a selloff and a recovery, and a problem getting through 7.68-7.70 resistance, which also is the top of a Symmetrical Triangle (Chart #2) If QXM can get through there, it would tell us that the market has received TWO earnings reports, has digested the news about the $70 million in convertible notes, and that it is willing to break the stock out (of the Symmetrical Triangle).

Next reistance would be the 7.85-7.88 highs, prior to April earnings, then the 200DMA, currently at 8.22.

Tuesday, May 20, 2008

AOB - Bearish Wolfe Wave


(Click On Chart To Enlarge)

Strong directional Lead-In to Wave 1. The pattern that followed was in the same direction as the Lead-In. Wave 5 upside fakeout. Breakdown of the pattern. Failed retest of the breakdown, then went directly to the target line, at Wave 6.

Saturday, May 17, 2008

NASDAQ 2530's Target MADE


(Click On Chart To Enlarge)

From April 18:

"A breakout would put the 2530's IN PLAY). "

The NASDAQ printed 2537.41 on Friday, just below the November 26, 2007 low of 2539.81, and right at the 2538 target. I didn't calculate it exactly, but it's very close. Nice rally out of the DOUBLE Inverse H&S.

Friday, May 16, 2008

VPHM: At The Top Of The Channel


(Click On Chart To Enlarge)

Since April 16, when VPHM and Wyeth ended HCV-986 Hepatitis C development (Purple #1 on the chart), VPHM has been trading in a channel. The second data point at the top of the channel (Purple #3) was right before earnings, and VPHM subsequently got sent down to the bottom of the channel, and also down near the bottom of the nine month Ascending Triangle (pattern in green, shown in my April 30 blog entry).

At yesterday's close, VPHM is back at the top of the channel, which comes in today, May 16, at 9.231, so a print of 9.24, which also was yesterday's high, is a technical breakout of the channel. We'd want to see 9.25 get printed, to take out yesterday's high.

The 20, 50, 200DMA's are all bunched together here at 9.13, 9.11 and 9.15, respectively, and VPHM closed above all of them yesterday, at 9.18, so that looks good. MACD is poised to cross above its signal line, so the stock looks good to go for a technical rally if it can take out 9.24.

Friday, May 9, 2008

UYG: Bearish Wolfe Wave


(ClicK On Chart To Enlarge)

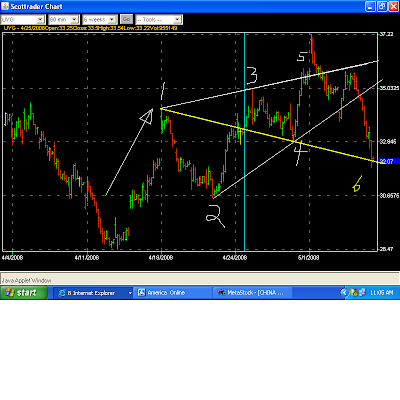
It was a tricky little devil, but the Bearish Wolfe Wave target MADE at #6.

Thursday, May 8, 2008

UYG: Wolfe Wave; CHL: Breakdown


(Click On Charts To Enlarge)

After the gap down break of the Bearish Wolfe Wave at the open on May 5, they took it all the way back to the top of the Wolfe Wave, fueled by a 17% short squeeze in Fannie (FNM), but UYG failed there. The Wolfe Wave got broken again yesterday and the target just might get MADE after all. It looks to be at about the 32.20s-32.30s, and there are TWO trendlines in the daily chart right in that area, at 32.23 and 32.26. (See Charts #2 and #3 above).

Chart #4: CHL closed on May 6 at 88.33, looking like it wanted to break out the Symmetrical Triangle (purple) to the upside for a bullish continuation, but it was called lower at the open yesterday, and opened at 85.87, BELOW the pattern, and BELOW Data Point #4 (purple) of the pattern, which was 86.06.

That kind of pattern breakdown/GAP DOWN opening usually isn't good. It gives a very strong suggestion that "this is just for openers," and that the stock is going down. CHL rallied only to 86.20, for a gap fill the prior day's low of 86.21 (another EXACT gap fill for this stock, like the 83.67 EXACT gap fill on April 22), then it faded, giving another VERY strong suggestion that the Symmetrical Triangle breakdown was for real.

Those using the "last low" of 83.68, prior to the run-up to 90.02, as their stop got taken out. 81.76 is IN PLAY. The 50/200DMAs currently are in the $78s.

Wednesday, May 7, 2008

AAPL: "The Scream"


(Click On Chart To Enlarge)

1. After the breakdown of The Bearish Wolfe Wave in the $190's, AAPL experienced a serious smackdown in the general market panic selling during the winter. It's best to stay out of those as far as buying is concerned, and give stocks a chance to bottom. We can see that AAPL put in TWO patterns during February and early March, a Bullish Wedge and a Symmetrical Triangle, then went on an upside screamer after breaking out of them.

2. Be careful about using Bullish and Bearish Crosses of moving averages to time entries and exits. The most widely used are the 50DMA (dotted green line) and the 200DMA (dotted red line). They made a Bearish Cross on March 6, with AAPL at 120.93 near Data Point #4 of the Symmetrical Triangle (pattern in blue) that was BULLISH. Anyone who used that Bearish Cross as an exit signal ended up capitulating near the bottom. UGH.

3. Analysts' comments, particularly downgrades, can be a tad annoying, if not a downright terror on one's nerves if a stock that we own gets whacked as a result. Try to be objective. If the stock hasn't done anything wrong, ignore the downgrade, and it might even be a good buying opportunity, as AAPL was at the 20DMA (dotted black line), the day after "The Scream" from Cramer, the afternoon of April 11.

The subject of this post is a send-up of the Norwegian artist, Edvard Munch's, painting, "The Scream," depicting a rather tormented-looking soul who doesn't look entirely dissimilar to Cramer when he goes on one of his vein-popping rants. LOL. (see comment at the top of the chart). Cramer is a brilliant man, and has great entertainment value, but he also is a reminder to me not to try to predict anything, but rather, try to FOLLOW the market, as best I can.

No offense to Cramer intended. In fact, I plain like the guy, and I also know that I am worse than anyone at predicting anything.

Tuesday, May 6, 2008

UYG - Bearish Wolfe Wave Trade


(Click On Charts To Enlarge)

In the daily chart, support at the up trendline came in today at 33.695. The morning low was 33.67, just a hair below it. At this morning's low, I was up $5,000 in my short trade from last Friday, but when UYG came back almost to UNCH on the day, I abandoned the trade for about an $1,800.00 gain, figuring that the Bearish Wolfe Wave breakdown got trumped by UYG finding trendline support in the daily.

My main concern was salvaging a decent profit, so "When in doubt, get out." I did.

UYG - Bearish Wolfe Wave Breakdown


(Click On Chart To Enlarge)

Gap down at the open, below the Wolfe Wave. The target line (yellow...#6) looks to be at about 32.50 - 32.60 currently. I can't measure it precisely on these hourly charts, like I can on the Metastock charts.

DRYS: The Case Of The Gartley Intrigue


(Click On Chart To Enlarge)

Technical Analysis very much is like trying to solve a mystery. At what point do we think that we have enough evidence to make an arrest (make the trade)? It varies in each case, and it also varies among all of the players in the market, of course. Let's look at what we've got.

The Body Of Evidence:

1. The top of the Cloud in the weekly Ichimoku Kinko Hyo chart that we looked at now is 94.625, which often acts as resistance. DRYS came out of the gate Monday morning and ran toward that level, but didn't sustain its bid for $94.

2. The point at which a 40.28 point rally completes for the CD = AB legs of the "possible" Bearish Garlety completes at 94.06. Yesterday's high was 93.88 (according my Reuters data...I saw 93.87 in trading). RARELY are target measurements exact. Yesterday's high was very close to the 94.06 target, so that objective has been met.

3. If getting through 94.00-ish is a problem for the stock, we want to see evidence of that, which would be a selloff from there, then a reversal to the downside. We got a selloff of nearly $3.00 from the 93.88 high on the day, to the 90.99 close. Now we want to see if ALL of yesterday's trading gets reversed.

4. Yesterday's candle is a Bearish Doji Star Hangman. Doji Stars aren't ALWAYS bearish (or bullish, at bottoms), but very often they are, and they at least are an alert to pay attention. Some examples:

a. The January 16 Bullish Doji Star Hammer was THE bottom of the year, thus far. It was followed by another one the next session. It was VERY Bullish.

b. The Bearish Doji Star on January 26, at the neckline of the Bullish Inverse H&S, was bearish only for one day, for a quick Right Shoulder formation of that pattern.

c. The Bullish Inverse H&S breakout candle on January 29 was a Doji Star and "possibly" bearish, but it was a DOUBLE BREAKOUT, and it was not at all bearish.

d. The Bearish Doji Star on Valentine's Day at earnings showed up after a HUGE rally, similar to the rally that DRYS recently has enjoyed, and it was followed up the next day with a "Gap To Crap" Bearish Engulfing pattern. BOTH were strong indications of a possible reversal.

February 22 (at Red #3) was a Dragonfly Doji Star (open and close both were at the top of the candle). ANOTHER indication of an impending downside reversal, and the Relative Strength Chart above was showing a negative divergence right there, which was another piece of evidence indicating a selloff.

e. The "real body" (open and close) of the St. Patrick's Day low isn't quite tight enough to be a Bullish Doji Star, but it sure has the look of one. "Close enough." The aftermath of that candle was VERY BULLISH.

5. Given those examples, we can see why we want to be alert, given yesterday's Bearish Doji Star Hangman, signaling a "possible" downside reversal.

6. Chart #2 above is the 13-21-34 sequential Fibonacci measures of Relative Strength. At yesterday's new closing high for the move, the 13 RSI is back above 70, just slightly lower than where it was at the April 23 high of 84.41, so that's looking like a non-confirmation of yesterday's new closing high, and it's set up for a "possible" Double Top, similar to what this indicator was showing before the February selloff. That's a "be alert for weakness" here.

What To Look For Today:

Yesterday's candle left a gap on the chart between Friday's 90.00 high and yesterday's 90.05 low. If DRYS should gap down below 90.05 this morning and never fill the opening gap, yesterday's candle would become a Bearish Doji Star Hangman AND a Bearish Island Reversal Candle, also known as "An Abandoned Baby." The implication is exactly what it sounds like. Imagine abandoning a poor little baby! A gap down like that would not be pretty, and personally, I would stop gathering evidence and GET OUTTA THERE, "right or wrong." Island Reversal candles are pretty reliable. Scroll down to yesterday's APPL chart and look at the TWO Bullish Island Reversal candles coming out of the August, 2007 low. HUGELY Bullish.

The top of the Bear Flag/Bearish Wolfe Wave in this daily chart comes in today at 89.72. Any close below that today at least temporarily reverses the upside breakout, putting the validity of the bullish breakout in serious question.

A black candle today that opens near yesterday's close and closes down near 87.25, or lower, would retrace half of Friday's white candle, and would put a 3-Day Bearish Evening Star on the daily chart. That's one of the most bearish patterns in the candlesticks, and also is fairly reliable. I've seen them taken out to the upside, but not very often. Those usually signal some kind of top.

So, Key Numbers for today:

90.00 - 90.05 - The gap
89.72 - Top of the flag
87.25 Close, or lower - Puts a Bearish Doji Evening Star on the chart

Monday, May 5, 2008

APPL: Wolfe Wave Example


(Click On Chart To Enlarge)

1. The long Lead-In began with the Bullish Island Reversal on August 16, 2007, from 111.62. We can see that the rally to Wave 1 was pretty much a straight up affair. I like long-g Lead-Ins like this one. It tips us off to start watching for a Wolfe Wave to form.

2. At the Wave 5 "Fakeout Breakout" there are three little Doji Star Hangmen, hinting at the impending reversal to the downside. This Wave 5 Fakeout was only a poke of the Head above the top of the pattern, but it still was plenty effective.

3. Notice how swift the move down to the target line (#6) was after AAPL closed below the Wolfe Wave pattern. Only two days. It hung about near the target line, forming a Symmetrical Triangle (little pattern in red) bearish continuation pattern, then got smacked to the downside some more.

4. The low of the pattern at Wave 2 (Blue #2) also is a target: 150.63 IN PLAY

5. In addition, we can measure the high and low of the Wolfe Waves, which also is essentially a Bearish Rising Wedge, to derive another target.

Math for the Big Blue Wedge portion of the Wolfe Wave:

High: 202.96 - Low: 150.63 = 52.33 points, subtracted from the trendline break.
The trendline (Blue #2 - Blue #4) broke at 192.53 on January 4, 2008.
192.53 - 52.33 points = a target of 140.20 IN PLAY

DRYS - Possible Bearish Wolfe Wave


(Click On Chart To Enlarge)

There are several good market lessons in this chart, so we'll do a quick review:

1. The Descending Triangle target of 40.42 didn't get MADE. Lesson: "Targets only are what the pattern suggests. Sometimes that fail to get MADE, sometimes that are exceeded by a wide margin. Monitor the trade, as it evolves."

2. The skimpy Double Bottom in January, at 48.21 and 48.75 was a clue that the Descending Triangle target might not get MADE when that pattern broke out to the upside, putting 67.03 IN PLAY. That breakout "suggested" a rally back to the broken Descending Triangle, which was just above the 67.03 target. Lesson: "Don't be stubborn, or get caught up in needing to 'be right.' Recognize a problem as quickly as possible (the Double Bottom breakout), and get out of any short postion."

3. After the breakout of the "skimpy" (narrow) Double Bottom, DRYS stopped to put in a Right Shoulder of a Bullish Inverse H&S. That strengthened the Double Bottom breakout, put 75.38 IN PLAY, "suggesting" that the 67.03 target had a VERY good chance of getting MADE, and also "suggested" that the target would be exceeded, and that the bottom of the broken Descending Triangle (69.61 - 69.81) would get re-tested. Lesson: "Multiple pattern breakouts 'tend' to pack some punch and increase the chances of targets getting MADE and/or exceeded." The Bullish Inverse H&S target of 75.38 was exceeded by a wide margin. DRYS rallied to 88.49.

4. The rally to 88.49 into release of earnings was the "flag pole" (similar to the "Lead-in" in a Wolfe Wave) for the "possible" Bull Flag that formed after earnings. The Bull Flag broke to the downside, and breakdown was validated on the failed retest at the bottom of the flag. The downside target of 65.71 also was exceeded by a wide margin, like the Bullish Inverse H&S was. Lesson 1: "Be particularly alert for a 'Sell The Good News' reaction to earnings after a strong rally into the event. Look for a "Gap To Crap." Look for a downside reversal candle, etc." Lesson 2: "Bull Flags aren't always bullish. There isn't any ALWAYS with patterns, etc."

In the current time-frame, we've got a "possible" Bearish Wolfe Wave. The "Lead-in" rally to Wave 1 is very similar to the "flag pole" rally into February earnings. Remember that Bull Flag that WASN'T bullish? We very well could have here a Bear Flag/Bearish Wolfe Wave that ISN'T bearish! Sort of a "For every action, there's an equal and opposite reaction" twist, if you will.

Regardless, I don't like to assume anything. This "possible" Bear Flag/Bearish Gartely broke out to the UPSIDE on Friday, so the Wave 5 "possible" Bullish Fakeout/Breakout is in. I'd want confirmation that it is a fakeout, which is why these fakeouts (if it is one) are so effective. "Nobody" wants to sell because the breakout looks real good, and "nobody" wants to sell short because shorting what appears to be a bullish breakout is a good way to get our heads handed to us on a short squeeze.

The top of the flag comes in today, May 5, at 89.43 and rises $0.286 per day, so we'll watch that trendline to see if DRYS closes back below it, and also watch the lower trendline, of course. As the chart stands at Friday's close, the upside breakout in DRYS is bullish.

Sorry for any mistakes. No time to proofread with market opening in under 1 hour.

Sunday, May 4, 2008

NAZ 100 Target MADE And Wolfe Wave Example


(Click On Charts To Enlarge)

From April 18:

"Chart #2: The NAZ 100 already has broken out of a Bullish Falling Wedge with a nested Symmetrical Triangle (green), which put 1954.99 IN PLAY, very near a 50% Retracement of the decline from last autumn."

The 1954.99 target officially MADE on May 1 this week, and then some. Friday's high was 1996.52, just below the top of the Bear Flag/Rising Wedge, which came in at 2000.52 on Friday. The slope of that trendline is 9.59, so we add that amount each day. It will come in on Monday, May 5, at 2010.11.

The bottom of the Flag was broken on a closing basis, on Wednesday, April 30, but that breakdown got reversed immediately at the open on May 1, after the Fed rate cut was digested by the market. The high on Wednesday was 1953.59, just a hair below our target of 1954.99, so anyone who shorted the rate cut on Wednesday likely used that high as a stop to "buy to cover" on Thursday's short squeeze, knocking out those stops. That, in part, accounted for the nice, big white candle on Thursday, back to the top of the flag. Friday's candle is a Bearish Hangman at the top of the flag, so we'll see if we get any selloff from that.

I threw in Chart #2 to go along with our recent discussion on Wolfe Waves, to reinforce the important elements. Notice that after the Wave 5 upside fakeout on Halloween, putting the proverbial "everyone" wrong-footed (it was a "trick," not a "treat"), the index went back inside the pattern, stumbled around, and then failed right at trendline resistance, on November 7. Right there is a nice place to short it, or short the takeout of the lows of the two prior days, roughly 2179-2181. Notice also how swift the move down to the target line at #6 was (only two days), and how the target was exceeded on the four day smackdown. That's an over-reaction to the trade being overcrowded on the wrong side at the Wave 5 fakeout.

Saturday, May 3, 2008

DRYS: Possible Bearish Gartley At $94-ish


(Click On Charts To Enlarge)

Bearish Gartleys and Bullish Butterflies probably are even more arcane than the Wolfe Waves that we've been discussing, and I'm certainly no expert at either one, or at anything else for that matter. LOL.

I think that the man who originated the former is Patrick Mikula (something like that), but he might only have done a lot of work on the patterns. I'm not sure. But, what I like about ALL of those rather quirky, non-traditional patterns is that they provide a way of identifying patterns and moves that the more traditional patterns don't.

Gartleys, Butterflies and Wolfe Waves all identify where players in the market are "wrong-footed," or crowded on one side of the trade, deceiving the proverbial "everyone."

In this DRYS chart, for example, we have the BIG, dramatic move down from the October high, similar to the sharp, directional "Lead-in" in a Wolfe Wave. From the low in January, DRYS has made two successive moves higher, so we've got "higher highs, and higher lows." We all know that's "supposed to be" bullish, and therein lies the deception! They turn out to be BEARISH "if" they are a valid Bearish Wolfe Wave, or a valid Bearish Gartley like this pattern in DRYS "might be," so we need to watch for that possibility.

There are all kinds of Fibonacci relationships between the moves in these Gartleys that I don't remember, but basically, we're looking to see if the current move from Point C to Point D is roughly equal to the move from Point A to Point B, which would be 94.06, and then see if the stock fails. Notice also that if you connect the two highs and the two lows, the pattern also looks like a BIG Bear Flag/Rising Channel.

In this particular case with DRYS, we've also got the top of the Cloud coming in last week at 94.61, very near the 94.01 area of the "possible" completion of the Bearish Gartley. The Cloud in the Ichimoku Kinko Hyo Chart ("At a glance...the Table of Balance") represents support and resistance. We can see that during the HUGE bull run, DRYS was well above the Cloud, with support below. No probem. On the first selloff into January, the top of the Cloud was support at Point A, and DRYS had a nice rally to Point B. On the second selloff, however, DRYS went below the Cloud to Point C, and throughout this rally to Point D, DRYS has being rallying into the Cloud, which now represents overhead resistance, and the stock hasn't quite gotten through the top of it yet.

Frequently, when a stock finally gets to the top of the Cloud,it's exhausted from battling through that resistance, and it sells off. Not always. There isn't any "always" in the stock market. LOL. But, given the fact that the completion of the "possible" Bearish Gartley "happens" to coincide with the top of the Cloud in the $94s, that's a reason at least to be vigilant if DRYS moves up to that level.

Lastly, what favors DRYS going higher and negating the "possible" Bearish Gartley is the fact that the MACD is looking so strong. That could get negated, too, but it does look good, per the comments on that chart above.

Financials: UYG and SKF


(Click On Charts To Enlarge)

The UYG mirrors the price action in the financials. The SKF is an UltraShort ETF.

The Bullish Case For Financials:

1. In Chart #1, we can see that the UYG formed a channel coming off the March 17 low. After the first four data points of the channel were established, the UYG went higher in an attempt to break out of the channel, but it failed right at the top of the pattern, at Green #5. That's called Validation of Resistance. That means that The Market is telling us, "Yep, that trendline connecting the highs at #1 and #3 IS VALID. That's resistance!" When a validated trendline gets taken out, that usually has "some" significance, and we'll see in a moment that it did.

2. The pullback from validated resistance was shallow. Rather than going all-ll the way back for another test of the bottom of the channel, there was a surcease in selling, and the UYG subsequently broke out.

3. The breakout was weak, but notice that on Wednesday of this week, the UYG held above the top of the channel. The was a very minor violation intraday, but it held on a closing basis, re-validating that trendline, but this time, validating it as support. Confirmation of that was the strong white candle on Thursday.

4. Chart #2 is the Ultrashort SKF. On Thursday, it failed at the top of a "possible" Bullish Falling Wedge (pattern in green), then broke down below its channel (pattern in blue) on a closing basis, confirming the bullishness in the UYG.

So, as the charts stand at Friday's close, the financials are BULLISH.

The Bearish Case For Financials:

1. Where the Bullish case would fall apart is if we've got a False Breakout in the UYG and a False Breakdown in the SKF.

Chart #2 shows the possibility of Bullish Wolfe Wave in the SKF, which would be bearish for financials since it is an ultrashort fund.

2. On Friday, the UYG had a "Gap To Crap" opening and slid back to close with a minor gain on a black candle. The SKF gapped down, but reversed and closed just below the channel/"possible" Wolfe Wave breakdown. Those need to be watched for any further signs of a reversal, specifically, the UYG closing back below its breakout in Chart #1, and the SKF moving back inside its channel in Chart #2.

3. Chart #3 shows a "possible" pattern "morph," or change, in the UYG from the apparent bullish Channel breakout that we have in Chart #1, to a Bearish Rising Wedge. What tends to militate against the Bearish Rising Wedge possibility is the fact that the UYG finally has turned it around and is trading above The Cloud (vertical lines) after failing at Cloud resistance quite a few times since last October. No guarantees, of course, but that a plus for the bulls.

4. Chart #4 is the MACD of the SKF (ultrashort). It's showing TWO bullish divergences in the histogram, not confirming the last two lows in the SKF. If the MACD: (a) ticks higher; (b) crosses above its signal line; and, (c) goes up through zero, I believe that triggers Dr. Alexander Elder's (author of Trading For A Living)"Hound Of The Baskervilles" signal. In the novel, the dog DIDN'T bark, so the murderer had to be someone that the dog knew. I'm not sure about why Dr. Elder chose that name for the signal, or even if I've got it right, but at any rate, it would be bullish for the UYG if confirmed by price, and bearish for the financials.

5. We've got a "possible" Bearish Wolfe Wave in the UYG in the Hourly chart posted below (on Friday), so watch to see if it comes back inside the pattern and heads toward the target line at #6.

The target line (#6) in chart #2 is very severe to the upside, so it doesn't seem likely that it ever would be achieved unless there's another shoe to drop in the financials ala CFC and BSC. Still, there could be some kind of upside in the SKF if it reverses higher back into the Wolfe Wave, and particularly if it breaks out to the upside, above the entire patterns.

So, just some things to watch for, in case we had a false breakout in the financials. Unless/until we would see some kind of reversal, they're bullish.

Friday, May 2, 2008

UYG: Possible Bearish Wolfe Wave


(Click On Charts To Enlarge)

WOLFE WAVES:

Step 1: THE LEAD-IN Start at an important high or low basis whatever time-frame you're using. There should be an obvious, sustained directional move during the Lead-in. There will be down days, but overall, a sustained directional move. When that strong move ends, that's Wave 1.

Step 2: The following Waves 2-5 have to be in the direction of the Lead-in. If the Lead-in was a rally, the next Waves have to be "HIGHER highs" and "HIGHER lows," like a Bear Flag, or a Bearish Rising Wedge. If the Lead-in was a selloff, the next Waves have to be "LOWER highs and LOWER lows."

Step 3. After Waves 1-4 are established, we're look for a WAVE 5 FAKEOUT of the pattern that puts everyone "wrong-footed," on the wrong side of the trade. In a Bearish Wolfe Wave, like these two example, The Bulls buy the breakout at Wave 5, and The Bears "Buy To Cover" the breakout at Wave 5, and it's exactly the wrong thing for everyone to do. As a result, the selloff is often sharp and swift.

Step 4. To determine the target line for Wave 6, connect the HIGH of Wave 1 to the LOW of Wave 4. If it's a valid Wolfe Wave, the target will get MADE, or pretty close to it.

Additional Comments: Wolfe Waves can look like Bear Flags/Bear Channels (parallel lines) in Chart #2, or like Bearish Rising Wedges, as in Chart #1. Also, it's nice if there is some symmetry between the waves, e.g. if the moves down from Wave 1-2 and from Wave 3-4 are equal in time, or have some Fibonacci relationship. Also look for symmetry between the two highs and the two lows (Waves 1-4)

In the first chart above, UYG "might have" just put in the Wave 5 upside fakeout on the opening "Gap To Crap" this morning. If this morning's high gets taken out to the upside, the pattern isn't valid. It might make a slightly "higher high," then fail, but personally, I'd cover a short position if this morning's high got taken out to the upside.

Also of note: the pattern (in blue) from Wave 3 down to Wave 4 is a Bull Flag/Bull Channel continuation pattern. That breakout put roughly 36.52 IN PLAY. That got MADE at the opening "Gap To Crap."

Chart #2 is a Bearish Wolfe Wave in NDAQ, in late 2006. We can see that after the Wave 5 fakeout, the selloff was fairly swift and sharp, and the target got MADE with no problem.

Thursday, May 1, 2008

NAZ 100 And SPX


(Click On Charts To Enlarge)

From last Sunday's Comments on the NAZ 100:

"This rally is looking like a Bear Flag..."higher highs and higher lows" AT RESISTANCE at the 200 DMA, and at the confluence of the 50% Fibonnaci Retracement and the Bullish Falling Wedge target:

1962,16 - is the top of the "possible" Bear Flag for Monday, April 28
1957.59 - is the 200 DMA, as of the April 25 close.
1954.99 - is the Bullish Falling Wedge target IN PLAY
1953.90 - is the 50% Retracement of the decline from Halloween

The 50/200DMAs in the NAZ 100, however, are badly inverted here: the 50 is well below the 200 DMA, by almost 200 points. While this index still "could" accelerate alot higher here like GIGM did, that doesn't seem likely without some kind of pullback/consolidation first. If we get into the NDX 1950's. I'd be inclined to protect profits and "sell some into strength" and particularly inclined to "take some profits when the target gets MADE."

Yesterday's high in the NAZ 100 was 1953.59, very near the targets and resistance. Nice 11% rally in just over one month's time from the March 24 Bullish Falling Wedge breakout, at 1761.72.

The index finished yesterday's session on a Bearish Engulfing pattern that also closed below the bottom of the Bear Flag. That puts 1867.72 and 1845.24 IN PLAY. The latter would be a fill of the April 18 gap, if it gets MADE.

The SPX was rejected again yesterday at TRIPLE resistance. Yesterday's run-up to a new high for the move, rejection, and subsequent selloff to a close below the prior day's low on a Bearish Inverted Hangman suggests at least a test of the 20DMA and possibly another test of the top of the channel support, roughly SPX 1368-1371.

A short squeeze likely would be on if the SPX takes out 1406 to the upside. Monday's and Wednesday's rallies to TRIPLE resistance were an invitation to sell and/or sell short, and given the sharp final hour selloffs both days, it looks like the shorts accepted the invitation. They'll have to "buy to cover" on any push through 1406 that looks convincing.