Monday, October 31, 2011

AMZN: Trick Or Treat


AMZN gapped down at the open with the general market, rallied above Friday's late session high, but that high was a "trick:" it was a Reversal candle.

Giving some confirmation that it was, indeed, a reversal was another "trick:" an upside Fakeout/Breakout (red arrow) out this Symmetrical Triangle, which quickly reversed back inside the pattern on an Inverted Bearish Hangman, then The Bears broke below it. That "shouldn't" have happened after the upside breakout, which gave a strong suggestion that the breakout was a fakeout.

I shorted 2,000 AMZN at 216.02 (white arrow) on the retest rally, back to the bottom of the broken pattern and to the bearishly inverted EMAs.


I covered minutes later, at 114.72, on the fast selloff back to the session low after the failure at the EMAs, for a nice Halloween treat ;)

I'm going to take some time off from posting. Been working too hard, but I'll be back. Happy Halloween, everyone!


Gain: $2,600

Saturday, October 29, 2011

GS: Double H&S Top Reversal


Basis the 1-Minute chart, Friday's Gap Down opening was a breakdown of a Double H&S Top. The white H&S Top forms The Head of the larger H&S Top, in yellow, and is "nested" within that larger pattern.

Frequently, we see Gap Up openings in stocks that result in a "Gap And Crap," where the stock reverses soon after the big opening higher, then goes down and fills most or all of the gap. Those are "common gaps." If the stock is bullish, it will hold somewhere near the gap, even below it, then climb higher. If it isn't, it can go well into the red and also can result in a significant downside reversal.

The same principle applies in reverse with Gap Down openings in stocks that are acting bullish, like GS has been off the early October Bullish Wolfe Wave Fakeout/Breakdown.

Friday's Gap Down in GS quickly reversed to the upside, looking for a retest of the broken neckline and some kind of fill of the two dollar gap down. We can see that the eighth bar ripped to the upside, back to the broken neckline. After a breakdown of a DOUBLE H&S Top, that neckline "should be" resistance. The Bears "should" defend it and send the stock down to a new session low. That isn't what happened.

The Bulls got back inside the broken Double H&S Top, which presented "Ye Olde Knuckle-biter" to The Bears, who managed to slap The Bulls outta there, down to Orange #2, but The Bulls came right back, up to Orange #3, back inside the broken pattern.

I bought 2,000 GS for 114.88, at Orange #4. The Bears weren't getting the job done on the downside, and The Bulls now had established a Symmetrical Triangle (pattern in orange) straddling the broken neckline, an upside breakout of which could launch a rally to the 116.18 - 116.40 gap left in the chart from Thursday's close. 116.18 was the low of the last bar; 116.40 was the close.

The gap-filling rally ensued almost immediately. I was in the trade for about two minutes and sold my 2,000 GS at 116.10 on approach to the 116.18 low of the gap. That worked out quite nicely, so I can refrain from cursing ;)


Just as they did going into Wednesday's close, The Bulls blew right through the 117.53 high of the Double H&S Top and established a new high for the move, at 118.07, where the rally ended in short-term Bear capitulation and Bull exhaustion.

The Bears broke a Descending Triangle (green pattern), then also broke validated support (orange arrow) of a Rising Channel (pattern in orange). When validated support gets broken, that "should have" some significance on the downside, but once again, The Bears didn't defend that broken trendline on a retest. The Bears allowed The Bulls back inside The Channel, willy nilly, as though it never had broken at all.

Sloppy...sloppy...sloppy on the part of The Bears, and since they weren't defending their Channel breakdown, I bought back my 2,000 GS for an average of 115.87 for a scalp. Sold them for 116.16, back inside The Channel.


Friday's rally to 118.07 took GS back to late August horizontal resistance, at 118.10. The Bulls have two closes above the Kumo (Cloud) and lots of room between here and the neckline, near 105.00, for a pullback. Roughly 124.25 is IN PLAY from the Inverse H&S breakout, as long as GS trades above the neckline.

I'm a trader and I don't make predictions. That target is just what the pattern breakout suggests. The picture could change as the chart evolves. If the target does get MADE, I would expect it to occur no later than December 5. Targets generally don't take longer to get MADE than it took for the pattern to form and, usually, they are achieved in less time than that.


Gain: $3,000

Thursday, October 27, 2011

GS: Shock And Awe To The Upside


From yesterday morning on GS:

"The measured move for the H&S Top went IN PLAY on the upside (add the points to the high of The Head) , as did the measured move off the Symmetrical Triangle breakout.

In addition to the Nested Symmetrical Triangle breakout in the intraday chart, The Bears also were caught short a Bullish Inverse H&S breakout in the daily, which no doubt accounted for some of the afternoon rally as they got squeezed into the $106's."

Regardless of whatever news will be given attribution as "the reason" for yesterday's upside explosion in GS, technically, The Bears were caught horribly out of position at Wednesday's close, short the Nested Symmetrical Triangle breakout in this intraday chart (yellow arrow), and short the Bullish Inverse H&S breakout in the daily chart.

Market Lesson: "Thou shalt not short, or stay short, Nested pattern breakouts and/or multiple pattern breakouts." YEEKS!!!


Breakaway Gap Up openings out of solid patterns like the ones that The Bulls had established in both the intraday and daily charts of GS that we've been following tend to be a "Gap And Go" rather than a "Gap And Crap," the latter of which reverses, then fizzles.

I didn't think that I'd get a chance at playing GS since I had no intention of chasing the opening gambit to 115.29 in fast market conditions, but there was a nice four dollar pullback to the EMAs, so I bought 2,000 shares of GS at 111.29-111.32 (white arrow).

The open was 110.33. The low was 110.00. My entry long was predicated on the thesis that on a Breakaway Gap out of the patterns that The Bulls had established in GS, The Bears weren't going to be let out of their shorts very easily, and that the session low quite likely already was in. If my thesis had been wrong, I would have stopped the trade out below the 110.00 low.

I wanted at least a dollar out of the trade. More, if I could get a quick rebound to sell into, then reposition at a better price.


About an hour into the trade, GS was noodling around the EMAs, digesting the huge opening gain. That looked fine, but I decided to take my dollar gain, and look to get back in if GS sold off into the 111's again. No luck with that. GS sold off only to 112.00, then began a steady climb to a high of 117.53, showing The Bears no mercy. UGH.


If I ever wrote a textbook on technical analysis, this last month in GS would be a thick chapter, it includes so many elements, which we've discussed these last weeks.

Among the most salient features, in my view, are:

1. The Bullish Wolfe Wave 5 Fakeout/Breakdown to 84.27 on October 4 on a Bullish Reversal candle

2. The H&S Top Fakeout/Breakdown to 100.08 at the October 25 close, which became Data Point #4 for a large Symmetrical Triangle (seen in the first chart, above). That head fake to the downside had an effect very similar to the Bullish Wolfe Wave fakeout on October 4, putting the proverbial "everyone" wrong-footed on the misdirection.

3. The move from $84 through the Kumo, to $117, occurred when poor earnings were expected and were actually much worse than anticipated. In early to mid-October, anyone who correctly predicted the big earnings miss got severely punished if they played that prediction by shorting GS, which is one of many examples of why I ignore the fundamentals, and why I always say:

"The fundamentals aren't what matter. It's the market's REACTION to the fundamentals that matters."


Gain: $2,000

GS: Inverse H&S Breakout


Basis the 10-Minute chart, Tuesday's close was a break below the neckline of a H&S Top. As we've frequently discussed, anything back above the broken neckline is "Ye Olde Knuckle-biter" for The Bears. An upside takeout of the high of the Right Shoulder (white arrow at the horizontal red line) is a "shot across the bow" from The Bulls, warning The Bears that the neckline break at Tuesday's close might have been a Fakeout/Breakdown.

I liked the upside takeout of the 102.50 high of the Right Shoulder and bought 2,000 shares of GS on the pullback, at 102.09.

GS rocked steady during the morning and hadn't come even close to filling the opening gap, showing excellent relative strength vs. the general market, but unfortunately for me ...


... the benchmark S&P 500 had filled its opening gap entirely, and also had taken out its late Tuesday afternoon low to the downside. UGH. It had rallied back to the second level of horizontal resistance (top red line) in what looked to be a Bearish Rising Wedge (pattern in yellow).

Hm-mm...what to do...what to do...

Was GS going to lead the entire index higher, or was the index going to drag GS down with it, to fill its opening gap?

The latter prospect seemed more probable and I was sitting on a decent gain, so I decided to take the money and look for a lower entry back into GS, if I could get it. I sold my 2,000 GS for 102.52.


Less than five minutes after I sold, GS broke out above $103 and was gone on the upside.

CURSES!!! That danged S&P 500 threw me off my game. LOL.


What a deceptive move that neckline breakdown was at Tuesday's close, huh?! That breakdown ended up being Data Point #4 (Yellow #4) of a large Symmetrical Triangle with the H&S Top nested within it. The early session "shot across the bow" with the takeout of the Right Shoulder was followed by the Nested Symmetrical Triangle breakout and then quickly followed by a takeout of the high of the H&S Top.

Uh-oh for The Bears, caught short a Nested Symmetical Triangle breakout!

The measured move for the H&S Top went IN PLAY on the upside (add the points to the high of The Head) , as did the measured move off the Symmetrical Triangle breakout.

The top of the Symmetrical Triangle now is Key Support on any pullback (yellow arrow). Anything back below Yellow Trendline #1-3 is "Ye Olde Knuckle-biter" for The Bulls.


In addition to the Nested Symmetrical Triangle breakout in the intraday chart, The Bears also were caught short a Bullish Inverse H&S breakout in the daily, which no doubt accounted for some of the afternoon rally as they got squeezed into the $106's.

As with the top of the Symmetrical Triangle in the intraday chart, The Bulls need to defend the neckline of the Inverse H&S pattern on any pullback.


Gain: $850

Wednesday, October 26, 2011

GS: Selloff From Kumo Resistance


Gap down in GS at the opening gong.

The stock put in a Double Bottom then made a "higher high." I bought 2,000 GS at 101.43 (white arrow) on the pullback to the prior highs that were taken out, which also coincided with the 13-21-34 EMAs, which were properly threaded. That looked like a nice setup for a run to 102.20-102.29 resistance (the two horizontal red lines).


"Former resistance provided support" where I bought it (horizontal white line) and GS rallied smartly to the target at next resistance, 102.20-102.29. I sold my 2,000 GS at 102.19.


After I sold (white arrow), GS pulled back, then broke out above the 102.20-102.29 resistance. GS came back below 102.20-102.29, for "Ye Olde Knuckle-biter," rallied again, then broke below (yellow arrow) what had become a pattern morph into a Rising Channel (pattern in yellow).

The Bulls tried to regroup and rallied it in a Bear Flag (pattern in red), but it was no good. The Bear Flag also broke to the downside, and down she went into the closing gong.


From Saturday on GS:

"At Friday's close, GS is parked right at the bottom rung of Kumo (Cloud) resistance, represented by the vertical red lines, which runs from 102.64 up to 114.765. That's daunting resistance, but if a stock is going to attack that kind of resistance, it's preferable for it to have established some kind of base from which to launch the rally, and "the bigger the base...the better the breakout."

The Kumo (Cloud) resistance was, indeed, daunting. The Bulls still have some room on the downside for a Right Shoulder pullback, or for Data Point #4 of an Ascending Triangle, without any serious damage being done the chart.

"The bigger the base, the better the breakout" so more consolidation below $105 wouldn't be at all bad, as long as The Bulls eventually can bring it and take out $105 to the upside.


Gain: $1,500

Tuesday, October 25, 2011

GS: Neckline Resistance


GS gapped up at the open and made a run for the neckline of the Inverse H&S basis the daily chart. That's resistance. It sold off from there, to the EMAs in the 10-minute chart. I bought 2,000 GS there, at 103.14.


Near-term resistance in the 5-Minute chart was horizontal resistance, at 103.52, up to 103.58, the top of the EMAs (yellow arrow). I sold at 103.52.


In the daily chart, GS entered the Kumo (Cloud) for the first time since late July and is at the bottom rung of that resistance, just below the neckline of the putative Inverse H&S.


Gain: $750

Saturday, October 22, 2011

GS: Inverse H&S Fractals Galore


Basis the 5-Minute chart, Friday morning's Gap Up opening was a Breakaway Gap out of yet another Inverse H&S! Notice that The Head of the pattern (in yellow) is a self-contained Inverse H&S.

Breakaway Gaps out of patterns have a better chance of being a "Gap And Go," rather than a "Gap And Crap." Although GS has scored 20 points off the Bullish Wolfe Wave Breakdown/Fakeout low of October 4 (rallied from 84 t0 104), basis the daily chart which we'll look at in a bit, the stock still is buried deep in Bear Territory, so Gap Up openings still are highly suspect.

The first white arrow was a successful retest of the neckline, then GS rallied. That retest was nice, but the gap still was left unfilled, which was bothersome. The rally off the neckline ended in a breakdown out of a Symmetrical Triangle (in green), which gave a strong suggestion that the gap from Thursday's 100.86 close would get filled, or something close to that.

We've seen pattern morphs left and right, so there was a chance that the Symmetrical Triangle would morph into a Channel or a Falling Wedge somewhere in the area of the neckline and the gap. Since GS has been performing so well lately, ignoring the lousy earnings that came out this week, I didn't want to get shut out of it so I bought 2,000 shares at 101.05 (second white arrow), despite the fact that I was buying "Ye Olde Knuckle-biter" because GS was back below the neckline.

Hindsight always is 20/20. When GS filled the gap, I thought, "Geez, ya coulda waited for that, ya dummy!" LOL. Easy to say, though, once we have the advantage of seeing what unfolds. It also "coulda" taken off to the upside without me ;)

GS filled the 100.86 gap, bottomed at 100.59, then rallied back above the neckline. It isn't fun sitting through "Ye Olde Knuckle-biter," but when there's a reason for it (in this case, filling the opening gap), I'll occasionally sit for it.


Another Inverse H&S breakout! Lovely. The earlier neckline break in the 5-minute chart was to go down and fill the gap, now The Bulls were ready to resume the rally. After sitting for "Ye Olde Knuckle-biter," I didn't want to see anything sloppy, back below this neckline. A penny or three back below the neckline, okay, but I didn't want the thing coming back in my face.

Git going!


Curses!

Thursday afternoon, I couldn't get a pullback to support to buy GS, now it was breaking neckline support for the SECOND time in Friday's session. No, thank you. I threw it in at 101.11.


It turns out that I threw in darned near the LOW on "Ye Olde Knuckle-biter," back below the neckline.

Curses!

GS rallied back out of the Inverse H&S, went into a Rising Channel (in yellow), then had another sloppy breakdown of the Rising Channel. If I had held my position, I would have sold that breakdown (yellow arrow).

Geez, sloppy...sloppy...sloppy.

I'll give The Bulls credit, though, for holding firm on that Channel breakdown and turning it into a Symmetrical Triangle (in green), then breaking out of it. There was only about ten minutes left on the clock when it broke out, so I had to pass on the breakout.


In the Hourly chart, The Bulls still have their Inverse H&S breakout.


Falling Wedges/Falling Channels often morph into Inverse H&S patterns. Interestingly, with all of the Inverse H&S patterns that we've had in the intraday charts, The Bulls have got a chance at breaking out of one in the daily chart. The putative Right Shoulder has some room to pull back some more, prior to any breakout.

At Friday's close, GS is parked right at the bottom rung of Kumo (Cloud) resistance, represented by the vertical red lines, which runs from 102.64 up to 114.765. That's daunting resistance, but if a stock is going to attack that kind of resistance, it's preferable for it to have established some kind of base from which to launch the rally, and "the bigger the base...the better the breakout."

This possible Inverse H&S base is of one month's duration, decent enough to attack that Kumo (Cloud) resistance if The Bulls can bring it.


Gain: $100 (Grumble...Grumble...Grumble)

Friday, October 21, 2011

GS: Inverse H&S Fractal


This is the hourly chart from Wednesday's close. The Bullish Inverse H&S is dominating the chart, so let's review what we were looking for in yesterday's session:

"In the Hourly Chart, despite the poor earnings, The Bulls have a chance at more upside if they can defend the neckline of this Inverse H&S pattern, the upside breakout of which helped to propel GS to the Wolfe Wave target. It currently comes in just below 100.00 and is declining a bit each hour.

Any trading below that neckline is "Ye Olde Knuckle-biter" for The Bulls, calling the bullishness of the pattern into question. Anything below the 94.52 low of the Right Shoulder would call the bullishness of the pattern into serious question. Right Shoulder lows "shouldn't" get taken down."


GS opened on a "Gap And Crap" and immediately broke below the neckline of the Inverse H&S, which was just below 100.00, handing The Bulls "Ye Olde Knuckle-biter."

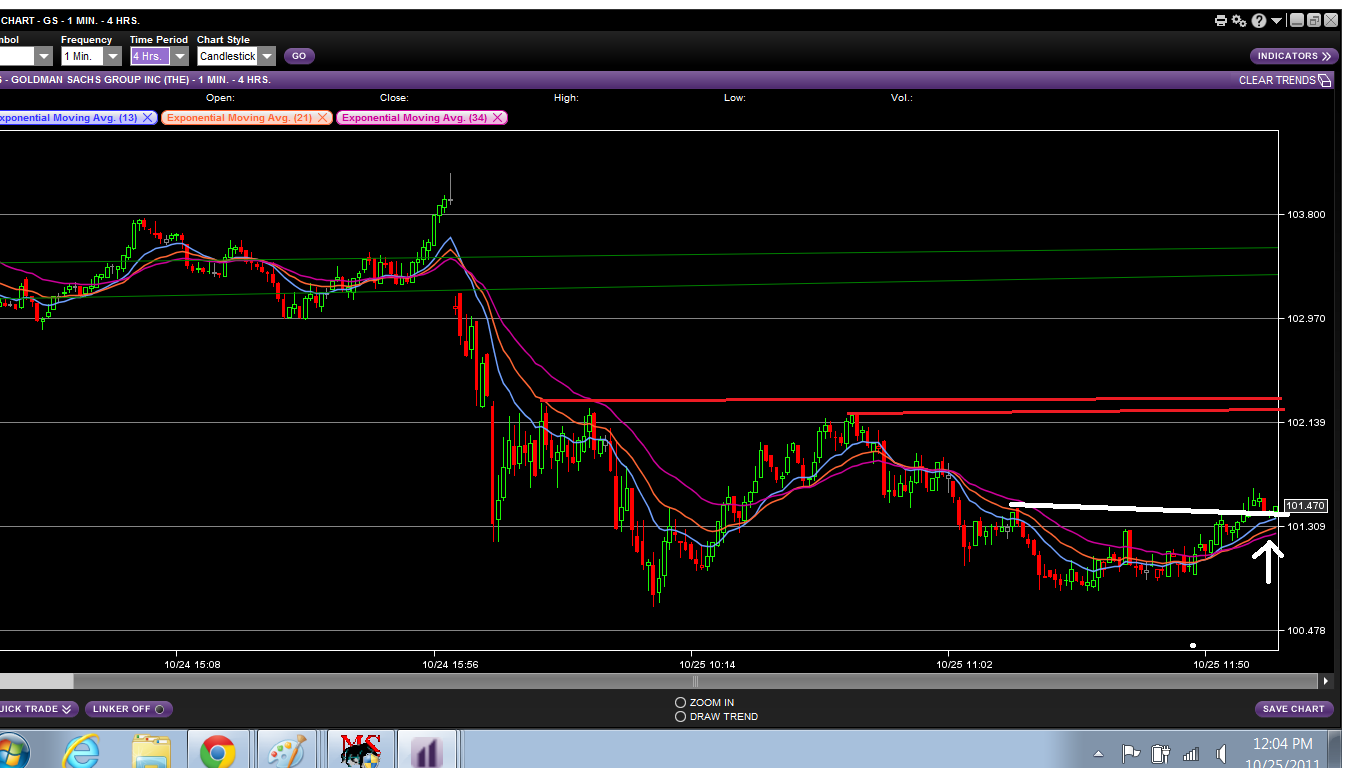
A Descending Triangle formed (pattern in white), which straddled the neckline, going above and below the neckline in the Hourly chart (first chart, above). That pattern resolved to the downside, sending GS deeper below the neckline. Not good for The Bulls.

The Bulls then put in a little Double Bottom (in yellow), broke out of it to the upside, then formed a Symmetrical Triangle (in orange) in an attempt to establish a second bullish pattern breakout. They weren't successful. The Bears broke the Symmetrical Triangle to the downside AND they took out the lows of the Double Bottom (in yellow), sending GS to a new session low. The Bulls had to start all over again. UGH.

The Bulls formed a little Rectangle (in green), but the problem with that little pattern is that if it were to break out to the upside, The Bulls had to rally into IMMEDIATE resistance from the broken Symmetrical Triangle and the broken Double Bottom. I wasn't interested in getting long a rally smack into resistance if The Bulls could break it out, but continued to follow the action.


The Bulls temporized for a bit longer, within The Rectangle, then broke it out. I liked that. "The bigger the base...the better the breakout." That wasn't a large base, but it was broader than where it was in the last chart, encouraging The Bulls who were trapped in the broken Symmetrical Triange and the broken Double Bottom NOT to sell when they got whole on the rally. The Rectangle breakout put a target of 99.26 IN PLAY. If The Bulls could get there, that would be "some" evidence that the low was in and that The Bulls were ready to do something on the upside.

Math for The Rectangle target:

98.78 - Identical highs of the pattern
98.30 - The more conservative of the 99.30 and 99.28 lows

98.78 - 98.30 = 0.48 points of upside on a breakout above 98.78.

98.78 + 0.48 = Target: 99.26 IN PLAY

The Bulls rallied to 99.248, just over a penny shy of the target, then pulled back for a retest of the top of The Rectangle. I liked that. I bought 2,000 shares of GS for 98.78 on the retest, which is an example of what is meant when we hear, "Pick your spot," or, "Let the trade come to you." Buying retests of upside breakouts and shorting retests of broken patterns are nice entries into a stock. We find out very quickly if it's going to be successful, or not, and if we're going to get into "Ye Olde Knuckle-biter" (back below the breakout), or an outright failure.


WHOA! The Bulls formed a Symmetrical Triangle (in yellow) after the successful retest of the top of The Rectangle, then broke out of it. We know that nested patterns and multiple pattern breakouts can pack some punch, so I was expecting a rally, but not tha-at much of a rally so quickly. GIMME THE MONEY and a minute or three to figger that one out!! LOL.

It didn't take long for me to say, "Oh-h, geez..."


(1) The failed Double Bottom, (2) the failed Symmetrical Triangle,(3) the Rectangle, and (4) the second Symmetrical Triangle all had "morphed" (changed) into a Bullish Inverse H&S pattern, a "fractal" of the large one in the Hourly Chart (first chart above)!

"Fractal" simply means a repeating pattern, or repeating behavior. The word was invented so that we can go round cocktail parties saying it, giving everyone the impression that we've got half a brain when we know that we really haven't. Say "fractal behavior" to people with whom you particularly don't wish to have intercourse. They'll flee your side in short order, in recognition of the fact that you've trumped them in the "boring conversation" department ;)

I wanted my 2,000 shares of GS back on a retest of the neckline, but didn't get it. The pullback was shallow, then she had another leg up.


The Inverse H&S target of 100.27 got MADE, and then some.


I also wanted my 2,000 shares back, at 100.43, on a retest of the late afternoon Falling Wedge breakout. I didn't get that one either. The pullback was only to 100.46. The Falling Wedge target of 101.55 got MADE. Without me. Curses!


This is the Hourly chart again, updated to include Thursday's trading. The Bulls had to endure "Ye Olde Knuckle-biter" for a bit, but managed to close the session out back above the neckline on the strength of the Bullish Inverse H&S fractal in yesterday's intraday chart.


Gain: $1,700

Thursday, October 20, 2011

GS: Bullish Wolfe Wave Target


The Wolfe Wave target got MADE at 104.69 in early trading yesterday morning. That's one for the textbooks, not only for its nice execution, technically, but because the bullish target was achieved against the backdrop of a huge miss on earnings on the fundamental side. Quite lovely.

What wasn't lovely...


...was the fact that when GS was called Gap Down at the open, I entered my order three minutes before the open to buy 2,000 shares of it at 100.75, well above horizontal support at 100.50. "They" blew past my order, down to 100.34, then ripped it to the upside past my order again, and left me pipped at the post with my order NOT filled.

I called my broker on that nonsense, who said, "Security and Exchange Commission Rule 611...yap yap yap...order protection...yap yap yap...market sweep...yap yap yap..."

I said, "So, you're telling me that I got '611-ed.' Is this a polite way that you youngins have of saying, 'YOU GOT ROYALLY SCWOOOED out of an $8,000 trade, Melf?'"

The lad gave a chuckle, but gave me no shares of GS at 100.75. That's fine. I handled it with my usual dignity.

Curses! Curses!! CURSES!!!


The Wolfe Wave target of 104.69 got MADE at 10:10AM shortly after it was explained to me how I got "611-ed." No problem.

LOUSY BUZZARD FACES!!!!!!!!!!!


There wasn't much left in The Bulls after the 104.63 target got MADE. The high on the session got put in one minute later, at 104.94, then The Bears took over, breaking the neckline of a H&S Top (in white), breaking a Bear Flag (in yellow), then breaking a Double Bottom attempt at 102.00 (in orange). The session finished with a Rectangle (in green).


In the Hourly Chart, despite the poor earnings, The Bulls have a chance at more upside if they can defend the neckline of this Inverse H&S pattern, the upside breakout of which helped to propel GS to the Wolfe Wave target. It currently comes in just below 100.00 and is declining a bit each hour.

Any trading below that neckline is "Ye Olde Knuckle-biter" for The Bulls, calling the bullishness of the pattern into question. Anything below the 94.52 low of the Right Shoulder would call the bullishness of the pattern into serious question. Right Shoulder lows "shouldn't" get taken down.

Wednesday, October 19, 2011

GS: Bullish Wolfe Wave - Lousy Earnings


Excerpt from Goldman's release of earnings:

"The investment bank said it made a loss applicable to common shareholders of $428 million or 84 cents per share in the third quarter, compared to $1.74 billion profit or $3.19 per share in the year ago quarter and $1.05 billion or $1.96 per share in the second quarter of 2011.

Goldman's results disappointed both on revenues and the bottomline. Analysts were expecting the firm to post a loss of 16 cents per share on revenues of $4.25 billion according to consensus estimates."

YEEKS. Big earnings miss, far below analysts' expectations. But, remember...

"It isn't the earnings that matter. The only thing that matters is the market's RESPONSE to the earnings."

The market's initial response was all over the board. A big gap up at the opening gong, with Bulls saying, "See-ee? That bad news already is factored in!" Then a complete retracement of the early rally and into the red with Bears saying, "See-ee? The bad news was NOT already factored in!"

Ain't we got fun? LOL.

First and foremost in my mind was the Bullish Wolfe Wave that we've been watching for the past week. We never want to "see what we wanna see" in the market. We want to FOLLOW what's going on, as best we can. If what we're seeing at any given time doesn't play out, we don't want to try to force our interpretation on the market when it simply isn't there. In this case, specifically, we don't want to get locked into the idea that the Bullish Wolfe Wave is going to play out, but we also don't want to get lathered up bearish because of the huge earnings miss.

By noontime, The Bulls had come roaring back off the early selloff, had broken out of the Channel (in white) and had formed an Ascending Triangle (in yellow) with a smaller Ascending Triangle (in orange) nested within it. Lovely. We know how nice nested patterns and multiple patterns can be on a breakout. I bought 2,000 GS at 98.90 in anticipation of a breakout. Mental stop below the 98.58 low of the little orange Ascending Triangle.


The little Ascending Triangle broke out, but "bigger picture," the entire session was a large, wide-swinging Symmetrical Triangle and GS got refused right at the top of the pattern (white arrow), validating it as resistance. Oops.

Additionally, GS was languishing as it moved into the apex of the Symmetrical Triangle. Thomas Bulkowski did research on those patterns and discovered that if stocks go beyond two-thirds of the way to the apex and don't break out, the majority of them fail and break to the downside.

Because of those two factors, I decided to throw it in at 98.88 for a small loss and wait to see what developed. I don't mind "paying up" for a stock if it looks right.


Well-ll...she broke out, just ahead of the apex! I was wanting to get long again on more of a pullback, but I also didn't want to miss a nice rally if GS was going to take off to the upside, so I "paid up" and bought back my 2,000 GS at 99.25 with the same mental stop of 98.58, the low of the little orange Ascending Triangle.


I bought at the yellow down arrow, then GS promptly came down and busted my 98.58 mental stop, by just two pennies! UGH. You're joking, Ms. Market, right??!! LOL.

That sure looked like a stop-busting "shakeout/fakeout" when it occurred, but I respected it and sold into a little bounce, at 98.70, determining that I would "pay up" again if GS got back over 99.00, which would be pretty good evidence that the break of 99.58 was, indeed, a fakeout. "If, at first, you don't succeed..."

I "paid up" again and bought back my 2,000 GS at 99.05 (orange arrow). That play finally worked. The Bulls formed the Symmetrical Triangle in orange, a "fractal" (repeating pattern) of the larger white one, then we got what we so often see with nested patterns and multiple pattern breakouts...

...KABOOM.

Despite the fact that the Bullish Wolfe Wave still was IN PLAY and that the rally "could be" much more explosive, as is the nature of Wolfe Waves, after two false starts, I sold into the upside Screamer, at 100.72. I was satisfied with that result and also was happy to give my old eyes a rest after watching the chart for five hours. I ain't as young as I useta be ;)


After a brief pullback, GS exploded to the upside again, putting in a session high of 103.79 (whew!), which...


... didn't quite make it to the Wave #6 target line, but it scored a big chunk of it.

Yesterday's market REPONSE to earnings was a case of the technicals trumping the fundamentals (much worse than expected earnings). That isn't always the case, but if we try to FOLLOW the market as best we can and focus on what is happening, we'll do alright.

My "best" certainly wasn't that swell yesterday, with the two false starts, but I came out of it alright. Trading the market is very much like playing poker. We aren't going to win every hand, but if we limit our losses and keep banging away at it, we'll do fine.


Gain: $2,200