Tuesday, March 31, 2009

HUI And GG


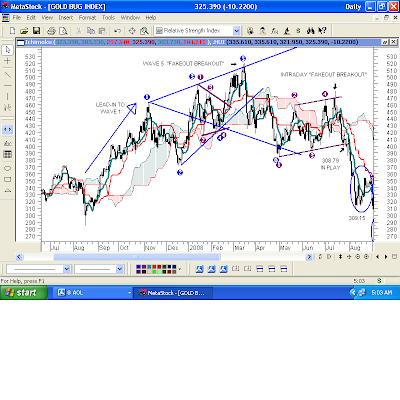
The gold stocks gapped lower yesterday morning, following through to the downside on what appears at the moment to be a Wave 5 Bearish Wolfe Wave Fakeout Breakout and a Bearish Evening Star pattern. The low of the session was 315.11 which sets up the second data point, along with the March 24 low of 314.06, for a mini-H&S Top, best seen in an hourly chart.

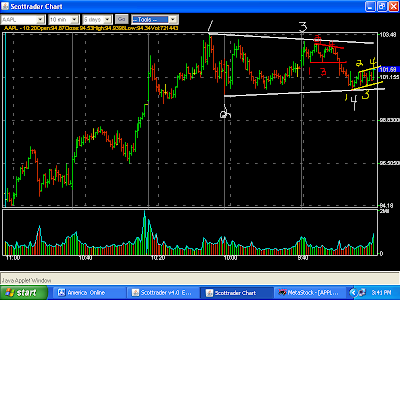
GG gapped down from 33.88 to 32.88. I entered orders to short it at 33.24 and 33.44, hoping to get in on a partial gap fill. I got more than I bargained for. GG rallied all the way up to fill the 34.53 gap in the intraday chart. The high on the session was 32.52, an exact gap fill, and the rally ended on a H&S Top.

That little H&S Top in the 10-Minute chart could be a fractal (repeating pattern) of a possible H&S Top in the Hourly Chart. Because of that and the fact that GG might rally some more to complete the Right Shoulder, I covered my shorts near the afternoon low and will consider re-entering short today with a better entry, or on a break of the neckline.


Gain on the trade: $1,200

Sunday, March 29, 2009

HUI: Possible Bearish Wolfe Wave


In early 2008, the HUI completed a Bearish Wolfe Wave. The key elements are:

1. A strong directional move (the arrow) to a Wave 1 Top.
2. A channel or wedge with Waves #1- #4 that form in the direction of the Lead-In (arrow).
3. A Wave #5 "Fakeout/Breakout," which in my view, is the hallmark of a Wolfe Wave. It's purpose, after a seemingly never-ending move in one direction, is to put the proverbial "everyone" wrong-footed at the Wave #5 fakeout, having both longs and shorts "buying and buying to cover" at exactly the wrong time.
4. The Wave #6 Target line is derived by connecting the high of Wave #1 and the low of Wave #4.

After the Bearish Wolfe Wave target MADE, the HUI went into a Bear Flag/Rising Channel, broke that, then tried to form a Bullish Inverse H&S, which failed. With the latter, instead of taking the measurement of the pattern and adding it to an upside neckline breakout, we SUBTRACT the measured move from the low of The Head when it fails. The downside target al-lmost got MADE, within one dollar.

Off the low, the HUI put in a skimpy "W"-Bottom, or Double Bottom, similar the the skimpy one that we looked at in Cleveland Cliffs (CLF). The target for this one also got MADE, regardless of which leg we used to measure the target.

In the current time-frame, we've got a possible Bearish Wolfe Wave again, and the minor Wave #5 Fakeout/Breakout also looks to be part of a 3-day Bearish Evening Star pattern, one of the most bearish in the candlestick patterns, if it holds up.

As with everything in technical analysis, there's no "always." This possible Bearish Wolfe Wave in AZO did NOT play out. It got trumped by the fundamentals, on earnings in early March.

You might remember that I shorted this one the day after the Bearish Doji Star Hangman breakout candle, on earnings. That candle was on very heavy volume and looked like it might reverse to the downside, but I threw it in for a $35 gain when it didn't.

Several sessions after the upside breakout, we can see that AZO found support at the top of the channel for two sessions, then continued higher. That actually was a VERY nice buy when the top of the channel held (former resistance became support). The 8 and 13 RSI's both came into Bullish Synchronicity, then gave a Buy Pivot signal. I wasn't watching it. "So many charts...so little time." LOL.

Currently, AZO is trading in another more steeply upward-sloping channel, which also has the look of a Bearish Wolfe Wave. The big directional "Lead-In" would be off the February 18 low (Blue #4), prior to earnings. AZO would need to have a Wave #5 upside Fakeout/Breakout up at the top of the channel, then failure, to be a Bearish Wolfe Wave.

It also could simply break the lower trendline (Red #2 and Red #4).

As it stands, though, AZO still is acting bullish off the upside Breakaway Gap, and off the successful retest of the top of the BLUE channel.

Friday, March 27, 2009

AKAM: Channel Breakout


One of the most difficult things for most investors to do is to realize a loss when a stock has a big "Take No Prisoners" Gap Down below support, but it usually is the right play.

From July, 2007 - July 2008, AKAM traded between 25.06 and 41.45. On August 1, 2008 AKAM gapped down to 25.06 exactly. That kind of open would seem to have some "intent" because it puts EVERYONE who got long the stock in the prior year under water and that kind of open usually is "just for openers" because it can and does get much worse in the ensuing days and weeks, as it did for AKAM.

The gap down and close below 25.06 support put a target of 9.22 IN PLAY.

40.90 - High (the more conservative of the 41.45 - 40.90 highs)
25.06 - Low

40.90-25.06 = 15.84 points of downside. 25.06-15.84 = Target 9.22 IN PLAY.

The November 20, 2008 low was 9.25, within three cents of the Double Top target.


Off the November low, AKAM has rallied 123% within this channel. After the parameters were established (#1 through #4), AKAM found resistance at the top of the channel on FOUR occasions, validating it as resistance.

Anyone who shorted any of the FOUR failures at resistance made a very reasonable play on a risk: reward basis. Stop it out if the top of the channel gets taken out on a closing basis, which never occurred. For a short-term play, shorting any of those failures was good for a quick profit.

Yesterday, however, AKAM closed above the channel. Uh-oh. That's a breakout above QUADRUPLE validated trendline resistance. Yes, it could be a Fakeout/breakout, but personally, I wouldn't stay short a breakout like that because Ms. Market has said, "That isn't resistance any more." I would take a reasonable loss rather than risk getting caught in a short squeeze. If it does turn out to be a Fakeout/Breakout, one always can get short later on.

Basis the weekly chart, Kumo (Cloud) resistance is from 19.74 - 26.295, and we've got MAJOR RESISTANCE beginning at 25.06, where AKAM broke down last August so if a short squeeze does transpire, there "should be" some willing sellers in that 25.06-26.295 area.

Thursday, March 26, 2009

CLF: Double Bottom


CLF had an incredible run through most of this decade, rallying from under $2 to a high of $121.95 in June, 2008. From that high, CLF was bludgeoned during the Bear Market, losing 90% of its value.

At the beginning of March, CLF put in a bottom and retested it mid-month for a possible Double Bottom (11.84 and 11.80), or "W"-Bottom (they're synonymous). The middle of the "W" (15.11) is the Buy Pivot. When that got taken out to the upside, it put a target of 18.38 IN PLAY. When calculating a target, I always use the more/most conservative of my choices, so in this case, I used the 11.84. It's fine to use 11.80, or even an average of the two. It's YOUR target that you're "aiming for."

15.11 - The middle of the "W"
11.84 - The more conservative of the two lows

15.11-11.84=3.27 points of upside on a breakout above 15.11 = Target: 18.38 IN PLAY
Using the 11.80 low would put a target of 18.42 IN PLAY.

This pattern is "skimpy" in terms of width, going up against all of that overhead resistance. Remember that targets against the trend are less likely to get MADE and monitor it along the way for any signs of trouble.


CLF took out the 15.11 Buy Pivot on March 19, printed a high of 15.72, but couldn't hold the breakout on a closing basis. The following session, it pulled back toward the 13.39 gap, but held at 13.62.


The March 19 breakout resulted in a thrust higher in the 13RSI. The March 20 pullback resulted in the 13RSI pulling back into Bullish Synchronicty with its "shadow," the 21 RSI (next number down in the Fibonacci sequence). That set up the 15.23 high of that day, March 20, as a "Buy Pivot." A print of 15.24 in the next session, a penny above the "buy pivot," was a technical buy signal based on this particular indicator.

The indicator doesn't know what the chart looks like, so we technicians have to decide whether or not we want to take the signal. Indicators do NOT tell us to buy or to sell. We evaluate the signal, and make a decision about it.

So often, I've read things like, "Technical analysis is saying BUY!" Perfect nonsense. It is the analyst who must evaluate the chart and any other technicals being employed, and come to a decision. I mention that just so no one thinks that technical analysis is going to TELL YOU the right answers all of the time. LOL.

In this case with CLF, we wouldn't have liked the pullback below the 15.11 breakout because that suggests a Breakout/Fakeout. But, in the next session when CLF:

1. got back above the 15.11 breakout,
2. printed the 15.24 Buy Pivot,
3. AND took out the 15.72 high of the breakout day..

We would have liked that a lot ;)

Smooth sailing to the target. There was a wedge (yellow) that morphed into a Bull Flag (white). Both the 18.38 and 18.42 targets got MADE. The high yesterday was 18.55 before CLF pulled back to 16.90 (most likely profit-taking at/near the target), then closed at 17.64.

Mark gets an "A" for his homework on CLF which, essentially, was correct. That's great that you guys and gals are working on this stuff, and it does require work!

Wednesday, March 25, 2009

AEM - Patterns And Targets


We last looked at AEM on February 25, the morning after it broke down below the BLUE Symmetrical Triangle. Notice that the 44.12 target did not get MADE. The low was only 44.66, which was fairly close given that the breakdown occurred at about 51.60, but the full measured move target of 41.94 target didn't come close at all. Targets don't always get MADE.

Instead of continuing to the downside, AEM went into the second Symmetrical Triangle (in black). After AEM put in Black Data Point #4, we now have the parameters of the Symmetrical Triangle, and we look for a breakout in either direction.

On St. Paddy's Day, the 89/144RSIs came into Bullish Synchronicity, meaning that the readings were very close, and that the 89RSI came back to "kiss" the slower 144RSI. That candle, circled in green, was a Doji Star "indecision" candle, and it was a "pivot" candle, meaning that if the 48.83 high gets taken out to the upside in the next session with a print of 48.84, the decision is made. That's a technical buy signal based on that particular indicator. It's up to the technical analyst to look at the chart and to make a determination whether or not to take the signal.

If I had been watching AEM on March 18 when it printed the 48.84 Buy Signal (I wasn't), I would have taken it given that the parameters of the Symmetrial Triangle were in place. Stop: 46.21, the low of March 18 before the Buy signal was given. Once the Buy Signal is given, that low "shouldn't" get taken down.

After the Buy Signal was issued, AEM took out the top of the Symmetrical Triangle at 50.06, which put a target of 57.40 IN PLAY. AEM had a big move on March 18 off that technical breakout.

Math for the Symmetrical Triangle:

52.00 - High of the pattern
44.66 - Low of the pattern

52.00-44.66 = 7.34 points of upside on a breakout at 50.06 = Target: 57.40 IN PLAY.

That target got MADE in Monday's session.

By the way, notice that BLUE #5, on February 23, was a trendline validation at the top of the BLUE Symmetrical Triangle. Those give a strong suggestion that we "should" get some decent downside if the pattern breaks down, which it did. Again, the final target didn't get MADE, but AEM had a decent selloff.

Tuesday, March 24, 2009

IBM, AAPL, FAZ & SPX


I'm watching "Fast Money" on CNBC. They're discussing how difficult this market is to play. Amen! I got long IBM on both Thursday and Friday, threw both of those trades in for a small gain when the upside breakouts came back in my face, only to see it rip to the upside yesterday. Sheesh...

"The market will disappoint the greatest number of people possible." IBM shorts certainly are disappointed. I was bullish TWICE on the "false start" breakouts above $93, and I got disappointed, too.

Yesterday's Rectangle breakout put 103.32 IN PLAY. 106.45 still is IN PLAY from the December Bullish Inverse H&S breakout. I "might" consider buying IBM on a pullback, but my feelings are hurt that I got snookered, so I'm not sure about that. LOL.

At yesterday's open, the top of the Symmetrical Triangle came in at 102.83. APPL gapped up to 102.71, printed a high of 103.30, then sold off and filled most of the opening gap.

A "Gap And Go" wouldn't have come back to the gap. It would have gapped up, had a minor pullback at most, then ripped to the upside.

A "Gap To Crap" would have opened like it did, come back in an apparent gap fill, but would have continued down, gone in the red, and would have kept going farther into the red.

Yesterday's action was a "Gap And Fill," for lack of a better term. The "TELL," that it very likely was bullish was when APPL rallied again and took out the morning high of 103.60, known as a "Buy Pivot." A print of 103.61 is a technical buy for anyone using that pivot. The Symmetrical Triangle breakout put a target of 106.06 IN PLAY.

103.48 High of the pattern minus the 100.25 low of the pattern = 3.23 points of upside on a breakout above the top of the pattern at 102.83 = Target: 106.06 IN PLAY.

When the 103.61 Buy Pivot got printed, the "logical stop" on the trade was the morning low of 101.75, or about two points of downside. The 106.06 upside target was a little over two points of reward if it got MADE, which it did. The risk:reward wasn't so hot, and after my TWO fakeout/breakout trades in IBM on Thursday and Friday, I decided to pass on the 103.61 Buy Pivot.

Ms. Market KNEW that I passed, so she rallied AAPL above 108, and closed it at 107.66. LOL.

Daily chart is looking real decent. AAPL has "turned the corner" higher, above the 103 Triple Top, and sits at a multi-month high.

From my weekend comments on FAZ:

"...take profits when targets get MADE" at this 34.50-34.80 Rectangle resistance area. We know that targets against the trend are less likely to get MADE. The trend has been down, and we're AT RESISTANCE, so if I had gotten long the Ascending Triangle breakout, I would take at least some off the table."

Oh, my. What an UGLY day for the FAZ. The "possible" Bearish Wolfe Wave simply turned out simply to be a Bear Flag AT RESISTANCE. Yesterday was a big Gap Down, and down she went for a 45% loss in a single session.

Oh, my.

Last Thursday, the SPX gapped up out of this channel, reversed, and also sold off on Friday. Bears were shorting there, and Bulls were looking for more of a pullback, to get long. Again, "The market disappoints the greatest number of people possible." Bears were forced to "Buy To Cover," Bulls were forced to buy the breakout at higher prices (like IBM and AAPL) if they wanted in.

A breakout of a downsloping channel like this one isn't he most bullish thing in the world because there's lots of lateral, or horizontal, resistance on the way up. This type of breakout usually results in some backing and filling.

Kumo (Cloud) resistance (the vertical lines) also is directly overhead, and coming down hard, which also suggests some backing a filling.

Marty Zweig (whatever happened to him?) had an indicator that had to do with 90% Advancing Volume up days within a certain period of time being bullish. Someone on CNBC yesterday pointed out that during this rally off the lows, there have been FIVE days in which 90% of the volume went to Advancing stocks. Check me on that for accuracy, if interested.

On a pullback, ideally, the top of the channel "should be" support since it was "former resistance." It comes in today, March 24, at 785.219 and falls at the rate of 2.993 points per session, so for the remainder of the month, the top of the channel will come in as follows:

March 24 - 785.219
March 25 - 782.226
March 26 - 779.233
March 27 - 776.240
March 30 - 773.247
March 31 - 770.254

Monday, March 23, 2009

IBM And AAPL


From pre-market Friday morning:

"I played it long from 92.48, but threw it in for about a $180 gain when it looked like the breakout wasn't going to hold on a closing basis. It didn't."

On Friday morning, IBM gapped up to 93.18, looking like Thursday's Fakeout/Breakout was, itself, a fakeout! Well, okay, I got back in at 93.28 and trade looked fine as IBM rallied to 95.00.

Have you ever been in a trade, thinking, "You HAVE to be joking!?" Off the 95.00 high, IBM formed a Symmetrical Triangle and broke to the downside. After the pattern breakout in the daily chart, above the 93.00s, one would expect that Symmetrical Triangle to be a BULLISH continuation pattern, and not see IBM break to the downside and head back toward 93.00. But, that's just what it did :(

When I saw the trade coming back in my face, I threw it for the second day in a row, at 93.34, for a paltry gain of $50. Sheesh.

Friday's candle is a Bearish Inverted Hangman. IBM still could break out again if the SPX rallies and knocks out key 803-804 resistance, but I haven't enjoyed the two "false starts" on Thursday and Friday's breakouts. LOL.

On March 6, AAPL broke down below the Bear Flag (in purple) on a JP Morgan downgrade. The target of 82.33 got MADE to the exact penny, then AAPL reversed and came roaring back to the 103 area where it found resistance, beginning with the 103.68 December high, then the highs of 103.00 and the recent 103.48. If AAPL can take out those highs, next resistance is the October high of 116.40. The recent $20 rally off the 82.33 low has been fairly parabolic, though.

This morning's big gap up in the futures has me suspicious, especially when I look at charts like this Triple Nested Symmetrical Triangle in AAPL. The pattern in red is a Descending Triangle (usually bearish), and the pattern in yellow is looking like a Bear Flag at the moment.

If AAPL has an upside gap at the open, it could be a "Gap To Crap," especially given the parabolic nature of the rally in the daily chart, and this toppy looking nested pattern in the intraday chart. If it's a "Gap And Go" above the $103's, then never mind. LOL.

I can't figure out why this last section is underlined. Sorry about that.

Sunday, March 22, 2009

FAZ: It Hunker Down at $30

My last comment on the FAZ, to Life Observer, after I closed out my short trade:

"It's at 30 resistance, where I shorted it this morning (at least I caught something in it the past two days...LOL). Next serious resistance is the 34.50-34.80 bottom of The Rectangle.

I'd like to see it hunker down here in the 30 area, and below, and build a nice base before attacking next resistance. A retest of this morning's low isn't out of the question either."

Here's what the FAZ did after that:


It hunkered down at the $30 area and built a nice base, this Nested Ascending Triangle. So often over the years, I am asked, "Now what, Melf?" "What's your next 'call' on this?" My only CALL on these charts is to do YOUR homework, and follow the chart as best you can, which is what I try to do. I don't know the future any more than the rest of you.

Up to this point in the chart, from my March 10 pre-market post on the imminent H&S Top breakdown at the open, we have had a total of at least THIRTEEN patterns and targets that got MADE, and I never CALLED a single one of them because I don't have divine knowledge of the future. LOL.

I only know whether or not I've got a pattern breakout (and, sometimes those are false breakouts/breakdowns) and what target that breakout or breakdown suggests is IN PLAY. Same applies to support and resistance. In my short trade in the FAZ that I posted last week, I shorted resistance and covered at support. I didn't KNOW whether that would be successful or not, but I had a game plan, and executed it.

They aren't "always" winners, nor do thirteen pattern targets in a row get MADE, but in this case, they did.

If we are FOLLOWING along (I was busy with my IBM trade after I covered my FAZ short), we can see that, indeed, the FAZ hunkered down at $30 and formed this Ascending Triangle with a nested Bull Flag (in yellow,) broke out from Patterns #14 and #15 since the smackdown from the March 10 break of the H&S Top, and put three more targets IN PLAY:

1. 31.60 - Bull Flag (in yellow)

2. 34.50 - 34.80 - Resistance at the bottom of The Rectangle that broke down and put 23.98-24.70 IN PLAY, where the FAZ bottomed last week. The low was 23.88, ten cents below that.

3. 36.36 - Ascending Triangle

We know that "nested patterns" tend to pack some punch, increasing the likelihood that the targets will get MADE. No guarantees. Targets only are "what we're aiming for," and they need to be monitored along the way.

In measuring the Ascending Triangle, I always use the most coservative of the highs to establish the target so that the expectation isn't overly ambitious. It's perfectly fine to use the highest high, and many technicians do. The highs were 30.12 ... 30.30 ... 30.22, so I'm using the 30.12.

30.12 - the 23.88 low = 6.24 points of upside + 30.12 = Target: 36.36 IN PLAY


The nice Ascending Triangle base, and subsequent breakout, launched Friday's rally in which the 31.60 Bull Flag target got MADE, and the 34.50-34.80 targets both got MADE. The Ascending Triangle target of 36.36 still is IN PLAY.

When a pattern target goes IN PLAY we, as technical analysts, have to look at the chart and try to make a determination about how realistic the target is. In the case of this 36.36 Ascending Triangle target that is IN PLAY, is there any resistance that would suggest that it might not get MADE?


There sure is! This entire Rectangle price area represents nearby resistance. That doesn't mean that the FAZ can't get through it, or won't get through it. It simply means that we have to decide what we want to do about it.

For example, anyone who bought the Ascending Triangle breakout in the $30 range has a lot of good choices, one of which is to "take profits when targets get MADE" at this 34.50-34.80 Rectangle resistance area. We know that targets against the trend are less likely to get MADE. The trend has been down, and we're AT RESISTANCE, so if I had gotten long the Ascending Triangle breakout, I would take at least some off the table.


Since the FAZ stuck the close on Friday slightly above the 34.50-34.80 bottom of the Rectangle resistance, I view that as a first down into FAZ Bear territory (for you football fans ... LOL), and view the short-term picture as Neutral as long as the FAZ trades above 34.50 - 34.80. Getting above 44.90 - 45.01, which is the top of The Rectangle, would be a SCORE for the FAZ Bulls.

As always, I have no prediction about what anything is going to do. I might or might not be following this particular fund next week, but if I were, I would do just what I've done along the way. Try to FOLLOW the patterns, as best I can, like this "possible" Bearish Wolfe Wave that might be developing. If that plays out, there will be a "Fakeout/Breakout" at Wave #5, then a move down toward the target line, at #6, wherever that is as the chart evolves. Just an example of watching to see if something unfolds, like the Nested Ascending Triangle did at $30, and like the other thirteen patterns did from the March 10 break of the H&S Top.

I hope that my nearly two-week analysis on the FAZ and the SKF has helped with pattern identification, establishing targets, support and resistance, etc. I have over-focused on the FAZ because a number of people are in the fund, but my purpose here isn't to do a play by play of a particular stock or fund, or to do other peoples' homework for them and hand out targets, so I would appreciate if people not ask me to do that with questions like, "What's your NEXT target, Melf?" Frankly, that begins to feel like, "What have you done for me LATELY?" I'm doing this for free, and although I try to be as generous as possible and will continue to try to do that over time, I ain't workin' this hard for free, and I doubt that anyone reading this would either ;)

My purpose has been to help to teach YOU how to do your own homework on these charts. Good luck to all of you!

Friday, March 20, 2009

IBM: Long Candidate


I shorted IBM for a scalp on Wednesday (see that posted, if interested) on the .618 opening gap retracement after the break of the short-term Double Top, but I covered for a dollar gain because, bigger picture, this daily chart is acting bullish.

IBM broke out of a Bullish Inverse H&S in December. The neckline has a severe downward slope, but what I liked about it was that the volume had the right look, and I particularly liked the successful retest (within five cents) of the neckline at the January 20 market low. That's called a trendline validation, telling us, "Yes, that trendline you've got IS SUPPORT, as it should be. Further validation of that came the next morning on the big gap higher, and upside follow-thru. Nice.


Currently, IBM is champing at the bit for a breakout of the pattern, which it did intraday yesterday. I played it long from 92.48, but threw it in for about a $180 gain when it looked like the breakout wasn't going to hold on a closing basis. It didn't. We're coming off SPX 803-804 resistance, so I didn't want to stay long on a possible "Fakeout/Breakout." but IBM is a stock that I will give strong consideration again on the long side if it looks like we're going higher.


Basis the Ichimoku Kinko Hyo chart, we can "See At A Glance...The Table of Balance" that IBM was bearish in the autumn, well below the Kumo (Cloud). That's the vertical lines. Coming out of its November low, IBM broke out of the Bullish Inverse H&S pattern and worked its way through Kumo (Cloud) resistance, then "walked down the Kumo (Cloud)" into the January 20 neckline retest low before banging higher "above the Kumo (Cloud)." I like how visual these Ichimoku Kinko charts are.

That rally ended in a Bear Flag, seen in the last chart.

Notice how the Kumo (Cloud) narrowed as IBM went into that Bear Flag high, then began to form a "rising cloud of support" as IBM sold off. IBM closed below it for only one day, on March 9, but it held above the February 25 low, turned higher, and now is champing at the bit (I always thought that it was "chomping" ... but, it's "champing") for a pattern breakout at the top of the Kumo (Cloud).

Finally, notice that while the general market went to a new low at the EVIL 666 (LOL), IBM remained well above its November low, showing very nice relative strength here.

Thursday, March 19, 2009

FAZ: Rectangle Targets And Resistance


I forgot this morning to put The Rectangle target that was IN PLAY. Two ways to calculate this since the highs and lows are disparate. Take the "lower high" (44.90) and the "higher low" (34.80) to get the more conservative target, which I like to do. That's 10.10 points of downside, subtracted from the 34.80 low = Target: 24.70 IN PLAY.

The "higher high" (45.02) minus the "lower low" (34.50) is 10.52 points of downside, subtracted from the 34.50 low = Target: 23.98 IN PLAY.

This morning's low was 23.88, ten cents below the low end target.

30.12 was the high, prior to yesterday's smackdown, so that's where we can expect resistance, especially after a rally of 27% of the morning 23.88 low. On a selloff from a test of 30.12, the breakout above 28.95 is first support.

"Are you paying attention YET, Melf? Slap! Slap! Slap! LOL."


Well-ll, I'm trying to. I put in an order to short at 30.05, below 30.12 resistance, and covered at 29.02, above 28.95 support, for a gain of $2,500. That takes a "little" of the sting out of NOT shorting yesterday afternoon ;)

IBM: Scalp - FAZ - In Freefall


I mentioned to Mark in the comment section that I traded IBM yesterday morning. I like to look for short-term scalping opportunities when a stock is indicated to gap on news. Yesterday, the WSJ reported that IBM was in talks to acquire JAVA. IBM was indicated Gap Down on the news. IBM had closed at 92.91 the prior session. It opened at 89.46, below the 90.45...90.45 lows of this Double Top, on heavy volume.

Knowing that the pattern was broken, I wanted IBM short for a quick scalp of a dollar if I could get it near the .618 retracement price of 91.59, if IBM rallied. I put in an order slightly below that, at 91.47, roughly two dollars above the opening price, and got filled on the quick rally off the open.

That worked out fine. Made $1,100 on it.

From yesterday morning on the FAZ:

"If the FAZ can successfully retest that low, the chart will be a Rectangle with similar highs and similar lows."

Freefall means "down she goes, and where she stops, nobody knows." The FAZ was so grossly oversold when it went into freefall, I "thought" that it could bounce out of nowhere and found it difficult to imagine that this broken Rectangle would play out, even when just before the noon hour, the retest failure of the 34.80 - 34.50 lows was apparent. The retest high (at the arrow) was 34.68 and the FAZ did a back flip off that resistance, and tanked.

I did not short it because I thought, "Be serious Ms. Market! The FAZ has come down from 115.50 on March 6 to 35ish, and you expect me to 'believe' that there's something like another TEN points of downside off this Rectangle's measured move?"

I forgot that Ms. Market told me a long time ago that Crashes/big moves occur from OVERSOLD conditions. I also forgot to LOOK and stop "thinking" or "believing" something. The pattern had broken, and the retest was a failure, and the morning low of 33.08 got taken down.

Are you paying attention YET, Melf? Slap! Slap! Slap! LOL.

Wednesday, March 18, 2009

FAZ: Ascending Triangle


From this morning;

""The FAZ once again is in jeopardy of going into freefall on the downside if Monday's 34.80 low gets taken down by very much..."."

The FAZ broke 34.80 in the early going, went into this Ascending Triangle, then broke down putting a target of 33.83 IN PLAY.

36.43 - (The more conservative of the 36.43-36.45 Highs of the pattern)

34.50 - Low of the pattern

36.43 - 34.50 = 1.93 points of downside from the breakdown, at 35.75.

35.75 - 1.93 = Target: 33.83 IN PLAY

On these pattern plays, try to structure a decent risk:reward, and if you're stopped out, STOP IT OUT.

In this one, the stop would be 36.46, a penny above the 36.43-36.45 highs of the Ascending Triangle. Entering at the 35.75 breakdown is a risk of $0.71 on the trade on a stop out. There was $1.93 to be had if the target gets MADE, so that's a risk:reward of just under 1:3.

After the breakdown, the FAZ tried to claw its way back inside the pattern, but when it failed, it went into a freefall decline, to 33.08, during which the 33.83 target got MADE.

That's the TWELFTH pattern target off the intraday charts that has gotten MADE in the past week, so there have been lots of opportunites to trade the FAZ, mostly on the downside. Jumping into to these ETFs without a plan can be very dangerous to your wealth. "Plan the trade, and trade the plan."

Morgan: Double H&S Top - FAZ: Back At The Low


From yesterday morning on the Morgan Double H&S Top:

"The first one broke down and put 23.92 IN PLAY. The larger one in white broke down and put 22.00 IN PLAY."

Morgan went down immediately yesterday morning, and the 22.00 target got MADE. The low was 21.73, followed by a rally of nearly 10%, to 23.83.

"Take profits when targets get MADE."

From yesterday morning on the FAZ:

"If the FAZ now can do something like rally to 44.90 to form a neckline, pull back to something above 38.00, which would be the low of the Left Shoulder, then knock out the 44.90ish neckline, that would put roughly 55.00 IN PLAY."

The FAZ was strong coming out of the gate at the open yesterday morning. It went up to 44.90 resistance and printed a high of 45.02, establishing the second data point for a possible Bullish Inverse H&S pattern.

On the pullback, we were looking for a low at something above 38.00, for the Right Shoulder. The FAZ dropped nearly five dollars from 45.02 before finding a short-term bottom, at White #1. From there, it traced out a Bear Flag from which it broke down, at 40.91. That put a target of 38.68 IN PLAY.

Math:

42.49 - High of the Bear Flag
40.24 - Low of the Bear Flag

42.49 - 40.24 = 2.23 points of downside from the pattern break, at 40.91.

40.91 - 2.23 = Target: 38.68 IN PLAY.

The 38.68 target got MADE at 1:30PM (Yellow #1) The low was 38.64. At that point, the FAZ still was above the 38.00 low of the Left Shoulder, so that was fine, but it needed to look sharp and get moving up to the 44.90 - 45.01 possible neckline because a Right Shoulder should be narrower in width than the Left Shoulder, and the selloff from 45.02 was getting long in the tooth in terms of time.

The FAZ rallied off the 1:30PM low, but by 2:30PM, it looked stalled, and it came off the Double Top of 41.22 and 41.30 (Yellow #2 and Yellow #4). When the highs are that close in this price range, it's fine to call this an Ascending Triangle. Since the high at #4 was eight cents higher than the high at #2, if we want to be picky, it's a Bearish Rising Wedge.

That pattern broke down, and put a target of 37.87 IN PLAY. Uh-oh. That target was below the 38.00 low of the Left Shoulder, and the bottoming process had gone on too long to be a proper Right Shoulder, best seen in this 10-Minute chart.

After the 45.02 morning high, we were FOLLOWING the chart for evidence of something bullish, but what Ms. Market told us was that the Bear Flag broke to the downside, the Ascending Triangle (or Bearish Rising Wedge, if you will), broke to the downside, and both bearish targets got MADE. No sign of anything bullish.

The FAZ once again is in jeopardy of going into freefall on the downside if Monday's 34.80 low gets taken down by very much, but it's "neutral" at the close, above support. If the FAZ can successfully retest that low, the chart will be a Rectangle with similar highs and similar lows.

As always, I don't predict anything. Over the past week in the intraday charts, ELEVEN pattern targets have gotten MADE, but I don't have any targets IN PLAY at the moment.

Tuesday, March 17, 2009

FAZ: Bull Flag - Morgan: Double H&S Top


After five bearish patterns emerged in the chart, and subsequently broke down, the FAZ put in a Bull Flag and broke out of it late in the session. Volume dried up a bit during the pattern formation, then increased on the pattern breakout that put roughly 39.00 IN PLAY. The FAZ did much better than that, and rallied to 42.68 horizontal resistance at the top of the second H&S Top, in blue.

That resistance is the horizontal yellow line in this chart. Next resistance is the 44.90 high of the first H&S Top, represented by the solid white line.

Above that, next resistance is the nested Symmetrical Triangles, in yellow and red. Notice that the yellow pattern broke down, but then rallied and "morphed," or changed, into the larger red triangle. As we've seen so often, those nested patterns can pack some punch when they break down, as this one did. Also notice that after the breakdown of the red triangle, the FAZ tried to claw its way back inside the pattern, but to no avail. It was resistance, and when the FAZ got going on the downside, longs who didn't sell were trapped inside the pattern.

If the FAZ now can do something like rally to 44.90 to form a neckline, pull back to something above 38.00, which would be the low of the Left Shoulder, then knock out the 44.90ish neckline, that would put roughly 55.00 IN PLAY.

44.90 - Neckline
34.80 - Low of the Head

44.90-34.80 = 10.10 points of upside on a breakout + 44.90 = Target: 55.00 IN PLAY

All of that is getting ahead of ourselves, though. I don't predict anything. I try to follow the market, as best I can, like the eight patterns on these two charts. The first seven patterns told us that the FAZ still was bearish. The eighth pattern told us that the very short-term trend turned bullish when the Bull Flag broke out, and when the 39.00 target got MADE, and exceeded.


Hats off to Susannah for sniffing out an impending top in Morgan!

After our discussion at the weekend in the "Morgan: Topping Example," picture me sitting here watching this DOUBLE H&S Top unfold. LOL.

The first one broke down and put 23.92 IN PLAY. The larger one in white broke down and put 22.00 IN PLAY. The horizontal red lines are the highs of the Right Shoulders. Many players will use those as their "buy to cover" stops on a short position because in a H&S pattern, the high of the Right Shoulder "shouldn't" get taken out to the upside once the pattern breaks down. When the second H&S pattern breaks down, the stop can be moved down to the high of that Right Shoulder. On any rally from here to retest the broken neckline (23.98-24.15), that Right Shoulder high (24.91) "shouldn't" get taken out.

Happy St. Paddy's Day, everyone!

Monday, March 16, 2009

FAZ: Bearish Rising Wedge - Descending Triangle


From this morning on the FAZ:

"If the FAZ breaks 38.00 by very much, it once again will be in freefall to the downside."

The two H&S Top targets of 39.06 and 39.00 and the Symmetrical Triangle target of 37.97 got MADE at the open. After a weak, failed rally to fill the opening gap, the FAZ formed two more patterns, both of which broke to the downside.

The first pattern is a Bearish Rising Wedge. Notice that #5 was a third "hit" to the lower trandline. That's called a trendline validation. When a validated trendline gets broken, it tends to have some significance. The breakdown put a target of 35.58 IN PLAY.

The second pattern is a Descending Triangle, the lows of which were 36.90 and 36.88. The target for the Descending triangle was 36.01. On the rally after the breakdown, the FAZ failed at 36.88, the exact low of the pattern. Remember at the weekend, we said that retests of pattern breakdowns are common, and are to be expected. This was a failed retest, which is a good place to enter a trade short. Cover when the target gets MADE. In this case, there was a lower target IN PLAY, so that's fine to hang in there for that target, or to cover "some" on the way down.

I won't do the math for these targets, but if any of you don't know how to calculate them, just ask.

Both the 36.01 and the 35.88 targets got MADE. Remember how much we've talked about the potential move when there are nested patterns, or multiple patterns. FIVE targets have gotten MADE in under 3 hours:

1. H&S Top: 39.06
2. H&S Top: 39.00 (the back-to-back H&S Tops in Friday's chart)
3. Symmetrical Triangle: 37.97
4. Descending Triangle: 36.01
5. Bearish Rising Wedge: 35.58

FAZ: Double H&S Top - Symmetrical Triangle


On Friday, the FAZ had an upside pattern breakout in the 1-Minute chart that put 44.60-44.90 IN PLAY. That got MADE (high on the session was 44.90), but then the FAZ put in these back-to-back H&S Tops, putting 39.00 and 39.06 IN PLAY. The FAZ then formed a Symmetrical Triangle at the neckline resistance of the second H&S Top (the one in yellow), best seen in this 1-Minute chart:

Symmetrical triangles, generally, are continuation patterns, and expect them to resolve in the direction of the trend, which is bearish. If this Symmetrical Triangle breaks down, that will put a target of roughly 37.97 IN PLAY, and based on the current opening indication, it will break down at the open.

If that target should get MADE, and if the FAZ can rally from near there, the FAZ Bulls will have a chance at a short-term Double Bottom with Friday's low of 38.00. If the FAZ breaks 38.00 by very much, it once again will be in freefall to the downside.