Gap down in GS at the opening gong.
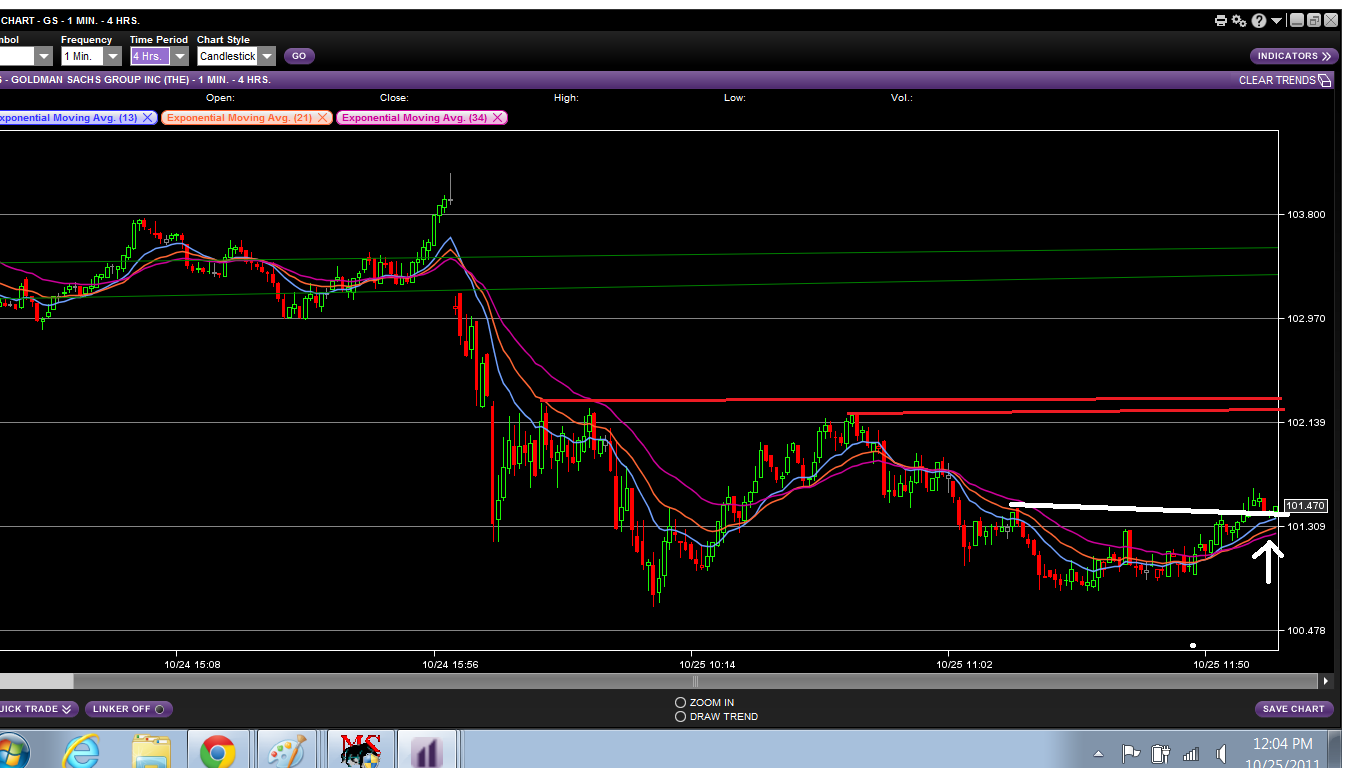
The stock put in a Double Bottom then made a "higher high." I bought 2,000 GS at 101.43 (white arrow) on the pullback to the prior highs that were taken out, which also coincided with the 13-21-34 EMAs, which were properly threaded. That looked like a nice setup for a run to 102.20-102.29 resistance (the two horizontal red lines).

"Former resistance provided support" where I bought it (horizontal white line) and GS rallied smartly to the target at next resistance, 102.20-102.29. I sold my 2,000 GS at 102.19.

After I sold (white arrow), GS pulled back, then broke out above the 102.20-102.29 resistance. GS came back below 102.20-102.29, for "Ye Olde Knuckle-biter," rallied again, then broke below (yellow arrow) what had become a pattern morph into a Rising Channel (pattern in yellow).
The Bulls tried to regroup and rallied it in a Bear Flag (pattern in red), but it was no good. The Bear Flag also broke to the downside, and down she went into the closing gong.

From Saturday on GS:
"At Friday's close, GS is parked right at the bottom rung of Kumo (Cloud) resistance, represented by the vertical red lines, which runs from 102.64 up to 114.765. That's daunting resistance, but if a stock is going to attack that kind of resistance, it's preferable for it to have established some kind of base from which to launch the rally, and "the bigger the base...the better the breakout."
The Kumo (Cloud) resistance was, indeed, daunting. The Bulls still have some room on the downside for a Right Shoulder pullback, or for Data Point #4 of an Ascending Triangle, without any serious damage being done the chart.
"The bigger the base, the better the breakout" so more consolidation below $105 wouldn't be at all bad, as long as The Bulls eventually can bring it and take out $105 to the upside.

Gain: $1,500

No comments:
Post a Comment