

(Click On Charts To Enlarge)
From last Sunday's entry:
"...as long as XING trades below the 10.08-10.00 bottom rung of resistance, it's bearish and the following downside targets are IN PLAY:
1. 8.82-8.994 (near-term support...the latter rises 0.029 each day)
2. 7.65-7.78 - (August - September lows)"
1. 8.82-8.994 (near-term support...the latter rises 0.029 each day)
2. 7.65-7.78 - (August - September lows)"
This week's low was 7.81, within three cents of the top end of Target #2 getting MADE, so that's close enough for a "possible" Double Bottom in the high 7's.
However, since we've still got three more downside targets IN PLAY, and since XING violated the up trendline this week in the monthly chart, we'll take a look at that chart.
In September, XING also violated the up trendline just slightly, which often occurs. That's known as a "shakeout," or a "Bear Trap." XING went on to put in a near-Bullish Engulfing candle in September, missing it only by three cents.
October, however, was a Bearish Doji Star that had two intra-month failures at the neckline of the 10-month H&S Top, and here in November, we're back to the bottom of the channel. The trendline comes in at 8.06, rising $0.12 each month. We want to see how XING handles both the trendline and 7.65 - 7.81 this week, going into the end of the month.
Chart #2 is the breakdown in XING below the 10-month H&S Top on July 17. A gap down opening like that is a fairly unmistakable sign that a stock has got technical problems, and when it doesn't recover quickly, that's good evidence. Sometimes, stocks will rally back to the breakdown, as XING did in late July when it rallied back to the broken neckline, but they don't always, and hanging onto a long position in those situations, hoping for a rally, can be risky business. "Bear markets descend on a cushion of hope."
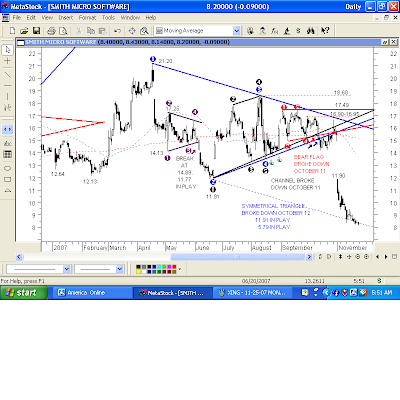
Chart #3, SMSI, is an example of the latter: a gap down with no rally whatsoever. SMSI had broken below THREE patterns in October, and spent the remainder of the month attempting to recover. On November 1, SMSI gapped down below the June low of 11.91, to 11.88, putting an entire year's worth of longs under water. The high on the day was a "show no mercy" 11.90, exactly one penny below the June low, not allowing any of the longs to get out for a break even.
Charts #2 and #3 are examples of what we want to watch for if XING hasn't put in a Double Bottom here, so that we aren't caught like deer staring into the headlights when we need to be taking action.

No comments:
Post a Comment