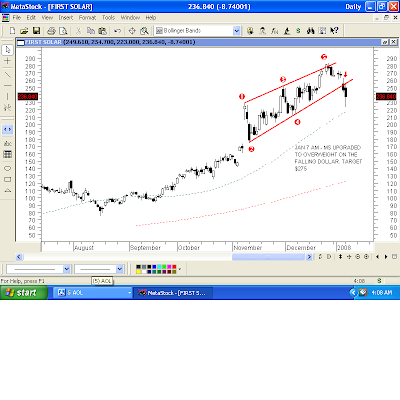


(Click On Charts To Enlarge)
I get a tad suspicious when an analyst upgrades a stock that just has broken support, like yesterday morning's Morgan Stanley upgrade of FSLR. The stock had closed Friday below the trendline breakdown and on the upgrade, FSLR rallied $9.00 to trendline RESISTANCE at $255, then tanked to an intraday low of $223. If Morgan wasn't selling into their upgrade of the stock, sumbuddy was! LOL. The selloffs in CSUN and SOLF were more severe.
CSUN was off as much as 20% intraday on a downside follow-thru of the Bearish Island Reversal and breakdown of the Symmetrical Triangle that we discussed yesterday morning. SOLF tried to rally to validated resistance at the upper trendline and failed miserably, also down 20%+ intraday from its high at the open.

2 comments:
Thanks, Oliver. Your Inverse H&S reminds me of the one that we discussed at 3SOF August-November, 2006. The neckline was 2.56-2.57-2.59.
That pattern had an Ascending Triangle sitting just to the left of it that had broken to the downside before the Inverse H&S showed up. That Inverse H&S broke out to the upside, but it failed immediately and TGB went back to 2.16 before rallying to 2.99 resistance.
The current pattern that you showed has a broken Double Top sitting just to the left of it (looks like the letter "M"). That breakdown below 5.08 put 3.96 IN PLAY. The low (of the Head) so far was 4.20.
3.96 still is IN PLAY unless/until the 5.32-5.29 neckline of your Inverse H&S gets taken out to the upside.
Good luck!
Thanks, Oliver!
Post a Comment