

(Click On Charts To Enlarge)
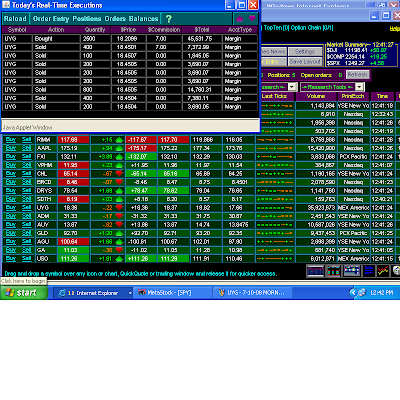
I tried the long side of UYG yesterday morning, but when the fourth pattern broke to the downside at 18.46, I took another gain of just under $600.00 and called it a day. Between 1:30 and 3:00PM, the UYG tested both extremes of the day, and neither Bulls nor Bears won the day. Basis the 10-Minute chart (#3 above), we're left with a Rectangle: Highs of 18.82 and 18.81...lows of 17.66 and 17.68, so we add or subtract the height of the pattern to or from whichever way the pattern breaks out. I always use the more conservative of the two numbers, so...
18.81 - 17.68 = 1.13 points, so 19.94 would be IN PLAY on an upside breakout; 16.55 would be IN PLAY on a breakdown. Futures are down hard at the moment, but we'll see.
In the daily chart, we've got a Bullish Doji Star Hammer. It's only bullish with upside follow-thru. Wednesday's candle was black, so if the UYG can break out above the Rectangle and CLOSE at 19.60, or better, the 3-day pattern, including today, would be a Bullish Morning Star.
The MACD is very supportive of a rally. There are TWO bullish divergences in the histogram (vertical black lines). As the MACD has fallen, the histogram hasn't confirmed that, has moved higher, and is ready to cross above its signal line on any rally. Something very important about bullish divergences: they're totally meaningless without PRICE moving higher. The first bullish divergence (Green #2) was when the UYG tried to double-bottom at 24.00. It was a deadly "buy signal" for anyone who bought that bullish divergence.
The UYG needs to take out the top of The Rectangle, at 19.81-19.82.

No comments:
Post a Comment