From my weekend comment to Katzo, regarding the SLV:
"In the current time-frame, the SLV looks better to me than the GLD, but I've got "likes" and "dislikes" about it."
Since we've been looking at GDX, GLD and GG, I thought that it might be worthwhile to take a look at the SLV.
Basis the weekly Ichimoku Kinko Hyo chart, we can "see at a glance...the table of balance" that in the Summer, 2008 when the SLV broke below the Kumo (Cloud), represented by the vertical lines, the SLV tanked to a low of 8.45 in October, 2008.
Off that low, the SLV formed a Symmetrical Triangle and broke out of that, then formed an Ascending Triangle and broke out of that. The 12.63 and 12.94 targets both got MADE, and more. The SLV topped out at 14.45 in late February, 2009.
We also can "see at a glance...the table of balance" how the Kumo (Cloud) acts as resistance when it is overhead. Generally, I find that the first attempt to get through it isn't successful, particulary when it's thick, like it is in this chart.
What I like about this chart is:
1. That the SLV possibly is trying to form another Symmetrical Triangle and break out of it, for a bullish continuation pattern.
2. Last week's possible Bullish Doji Star Hammer, which would be Data #4 for the Symmetrical Triangle if last week's low of 11.94 holds up, and if the SLV breaks out above this pattern.
3. The fact that the SLV has been consolidating its gains off the October low while trying to get through Kumo (Cloud) resistance. Structurally, that looks nice.

Basis the daily Ichimoku Kinko Hyo chart, we can "see at a glance...the table of balance" that the April 6 gap down in the SLV also was a gap down below the Kumo (Cloud), which now represents overhead resistance. That isn't fatal, but it's more difficult for the SLV to move higher than it was when it broke out of the Ascending Triangle (pattern in purple) in January. That breakout also was well above Kumo (Cloud) resistance, and it was clear sailing to 14.45.

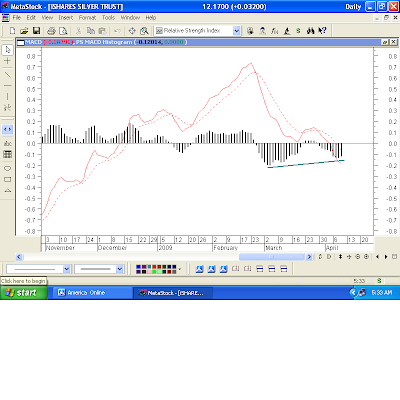
The MACD histogram ticked higher on Wednesday, and has put in a positive divergence. I like that, but a positive divergence without price confirming it by moving higher is meaningless. It's a plus, though. We now would want to see the MACD itself tick higher, and then go up through its signal line.

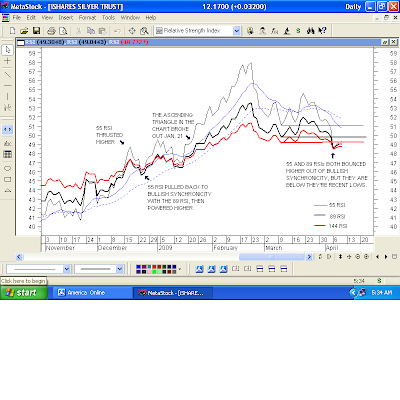
The 55 and 89 RSIs both went into bullish synchronicity with their respective "shadows" (the 89 and 144 RSIs), and have bounced higher. I like that. I don't like the fact that the readings are "lower lows" (horizontal lines), but the SLV still could move higher. The "buy pivot" signal was given at 12.21 when the SLV took out the 12.20 high of the pivot day.
That's just a buy signal from this particular indicator. It's up to us to look at "the body of evidence," and decide if we want to take the signal.

The pivot candle from the 55 and 89RSI "buy pivot" is circle in green. The 11.94 low of that candle "shouldn't" get taken out. That 11.94 low also is the putative Data Point #4 for the possible Symmetrical Triangle bullish continuation pattern, so if it does get taken out, that pattern is invalidated.
I like the fact that the 50/200Day Moving Averages made a Bullish Cross on March 27. The 50 is the dotted green line; the 200 is the dotted red line.
The GLD chart puts me off, but I'm considering buying the SLV with a stop below 11.94for a low risk:reward play (always excluding a gap down in ensuing sessions). In January, 2009 the GLD had a false breakdown out of a rising channel (see last week's charts), but the SLV was looking very decent and both ended up having a nice rally. That might be the case again here.

3 comments:
The SLV is indicated to gap higher at the open, above last week's high of 12.26, currently at BID: 12.32 ... ASK: 12.33. Curses! LOL.
If that should hold up and the gap doesn't get filled, that would leave a Bullish Island Reversal on the chart coming off Data Point #4 of the Symmetrical Triangle.
I entered a limit order in pre-market, but they wouldn't fill me and it's now enough above my limit that I'm not going to get filled.
The SLV now is indicated at BID: 12.46 ... ASK: 12.47.
Curses! Curses!! LOL.
Silver has jumped higher, up 3%, and so has the SLV, now indicated at BID: 12.56 ... ASK: 12.57. I'm not going to chase it.
Post a Comment