
(Click on charts to enlarge, then click on them again for further enlargement. Use back arrow on your browser to return to narrative)
From Friday morning:
"As we know, multiple patterns and/or nested patterns can "pack some punch" on a breakout, so we'll see."
KAAAAAAAABOOM!!!
FCX opened slightly above the Double Nested Symmetrical Triangle of 58.53 that was IN PLAY, so I sold into strength again and "took at least 'some' profits when the target got MADE." I sold all of it, filled in pre-market trading, with the idea of jockeying for position again and buying the shares back if I could get them for 57.72, slightly above the 57.68 gap. The order was filled in the afternoon. More's the pity, which I will explain later.
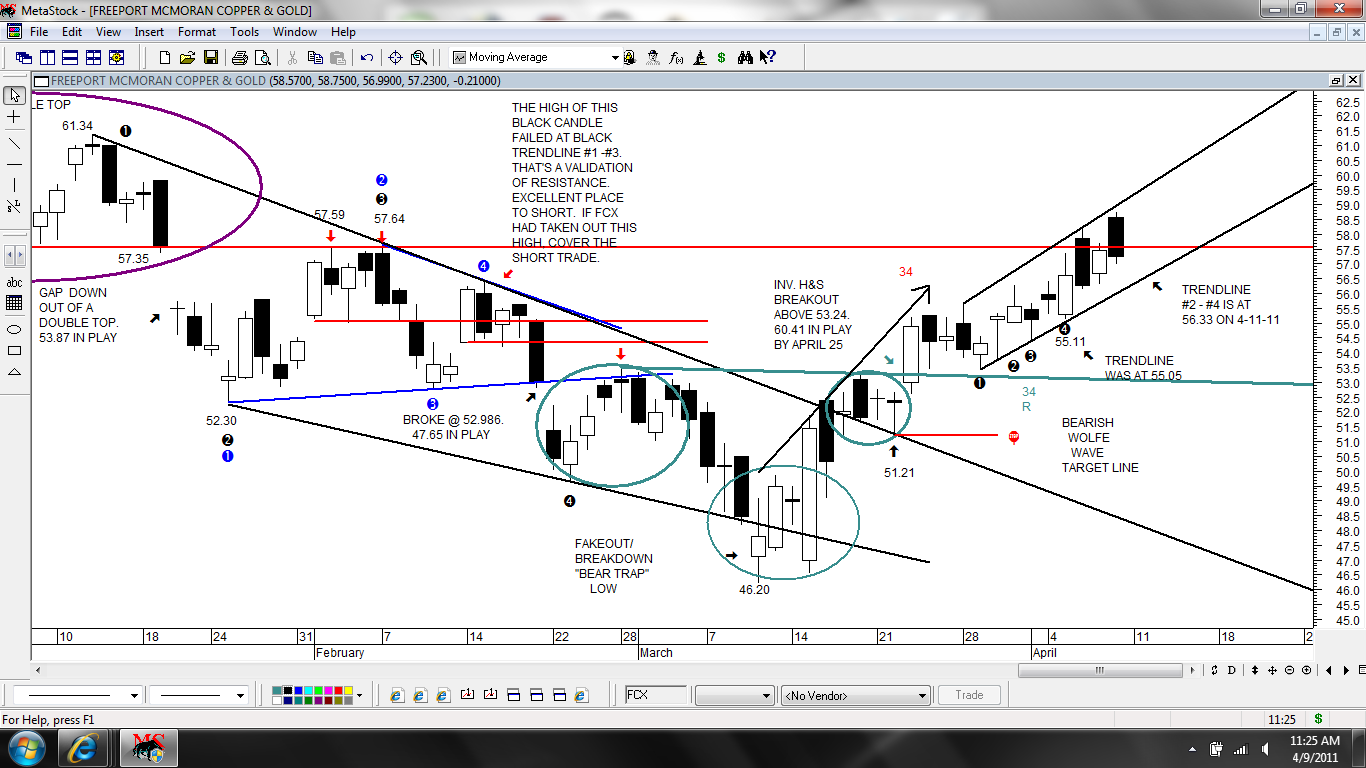
I apologize if this chart is so "painted up" that's it's unreadable, but there are some important things about last week's trading that I want to discuss, and it's easier to explain if you can see it. This is way-y-y too much infomation for the average person, I'm sure.
Beginning with the Symmetrical Triangle (purple pattern) in Friday's trading, it's nested within a larger Symmetrical Triangle which you'll see in the next chart, but I wanted to make it easier to see what went wrong here. The Bulls had a "foot fault" breaking slightly below Trendline #1 - #3. They recovered, but then made a lower low than they did at the "foot fault." That's a sign that the stock is vulneralbe to rolling over to the downside. Bulls simply didn't have game. The Double Nested Symmetrical Triangle (next chart) broke down in earnest, and The Bears had a downside target of about 56.95 IN PLAY.
KEY SHORT-TERM SUPPORT: 56.99
When a stock breaks down like that, we always want to see if we can identify an important support. In this case, if we look back to the Double Nested Symmetrical Triangle of Thursday, 56.99 was Data Point #4 for the Falling Wedge, as well as Data Point #4 for the White Symmetrical Triangle. The "nested" pattern was completed right there at 56.99, so that was "last support" prior to The Bulls exploding out of it at Friday's opening gong. On any selloff that is more severe than a "Gap and Crap" fill of the morning gap, we went to see if "last support" at 56.99, or something close to that, will be support on the selloff. The Friday afternoon low was 56.99, exactly. While we can't expect exactitude from technical analysis (it ain't rocket science), it amazes me how often we do get it, within a penny or three!
NEXT LAYERS OF SUPPORT:
56.59 - That was the Double Low of the Descending Triangle on Thursday (pattern in red), also exact at 56.59 and 56.59.
56.33 - That's where the bottom of the Rising Channel in the daily chart comes in for Monday, April 11. The slope is 0.32, so add that amount each trading day.
56.14 - The low of the Falling Channel (pattern in orange).
55.11 - Bottom of last Monday's channel (pattern in lime green)
I'm sure that we can extend trendlines and come up with other numbers, but that's difficult to do on these intraday charts. These are support areas that we can "eyeball."
So-o-o...56.99 now is validated short-term support. Ms. Market said on Friday afternoon, "You wondered if 56.99 would provide any support? Here ya go, yes, 56.99 IS support!"
We then get on our knees and say, "Thank you, Ms. Market, but what if 56.99 ISN'T support in Monday's trading? How low is FCX going? Is it going to be horrible?"
Ms. Market glares at us for having the cheek to ask her to tell us in advance what she intends to do, and says with slight annoyance in her tone, "I showed you an example of that last week. LOOK AT THE CHART."
Oh-h-h-h...we quickly get off our knees and go and have another peep at the chart.
When FCX broke down below the mini Double Top on Tuesday (little circle, just before the Falling Wedge in blue, the breakdown put 46.27 IN PLAY. FCX didn't go that low. It found support at 56.40 exactly, which was to top of Monday's channel (pattern in lime green), then completed and broke out of the light blue Falling Wedge prior to the close, which lead to Wednesday's "Gap And Crap" opening in which the H&S Top target of 57.85 got MADE.
On the selloff that lead to the formation of the channel in orange, validated support at 56.40 got broken. FCX finished the session below 56.40 validated support, and the candle in the daily chart sure looked like a "possible' downside Reversal Candle. UGH. That action certainly gave trades reason NOT to hold their positions overnight, and wait to see what Ms. Market had to say the next session about the falling channel (pattern in orange).
Ms. Market's answer came right at the opening gong on Thursday, when FCX opened with a Breakaway Gap out of the orange channel, pulled back and filled almost all of gap, then moved higher. That was a very strong indication that the breakdown of 56.40 validated support was a "shakeout." Traders who sold their long positions had to "pay up" at higher prices to get long again. There's not only nothing wrong with "paying up" in that situation, it's very good play. It's a good example of "When in doubt, get out!" There certainly was enough reason to be cautious, and to wait for Ms. Market to show her hand.
So-o, we now know that the answer to our question is, "No, if 56.99 validated support gets taken down in Monday's trading, that isn't necessarily anything horrible." If we decide to sell a break of that validated support and wait to see what develops, that's certainly a very reasonable play, especially since The Bulls aren't positioned here as nicely as they were at the bottom of the orange channel. That pattern was finished and ready to pop to the upside Thursday morning on any excuse at all. All the Bulls did on Friday afternoon was bounce off 56.99 and validated it as near-term support, then limped to the wire.

Here's Friday's Nested Symmetrical Triangle. The height of the pattern, subtraced from the point of the breakdown gives us approximately 56.95 IN PLAY, which essentially, already has MADE.
I got punished for trying to wear two hats, jockeying for position with my core 500 shares of FCX. I didn't watch the market Friday, but rather, went out and enjoyed my inital spring foray into my garden. If my order to repurchase my shares at 57.72 got filled, that was fine. Fine if it didn't. If I had seen this Nested Symmetrical Triangle break down around 57.90, right above my 57.72, I would have yanked that order in a nanosecond! LOL. I keep telling myself that it's a POSITION trade for the 60.41 Bullish Inverse H&S target that still is IN PLAY basis the daily chart, but the trader in me won't hear of it. "You moron, Melf Elf! Out digging dandelions when you shoulda been watching the market?! Yap yap yap."

Gain on the session: $975
Gain on the 15 FCX trades since March 23: $13,025
Open position: 500 shares purchased at 57.72.
As unpleasant as Friday's action was for The Bulls, they've got some leg room
between here and the Bullish Inverse H&S neckline, which is just above 53.00. If a retest of the neckline were to eventuate and The Bulls could successfully defend it and mount another rally, that only would serve to make the daily chart stronger for another attack on the winter overhang of resistance.
The bottom of the Rising Channel comes in on Monday, April 11, at 56.33. The slope is 0.32, so we must add that amount each day, e.g. it will be at 56.55 on Tuesday, April 12. That's a validated trendline. It's got four "hits/near hits" to it. 55.11 was within six cents of that trendline. Everyone knows how I feel about validated trendlines, or I wouldn't put them in annoying boldface. LOL.
Apologies if any of the numbers are mistyped or incorrect. It's a pain in the neck toggling back and forth to look at the charts to make sure that I got them right, and I often make mistakes.

No comments:
Post a Comment