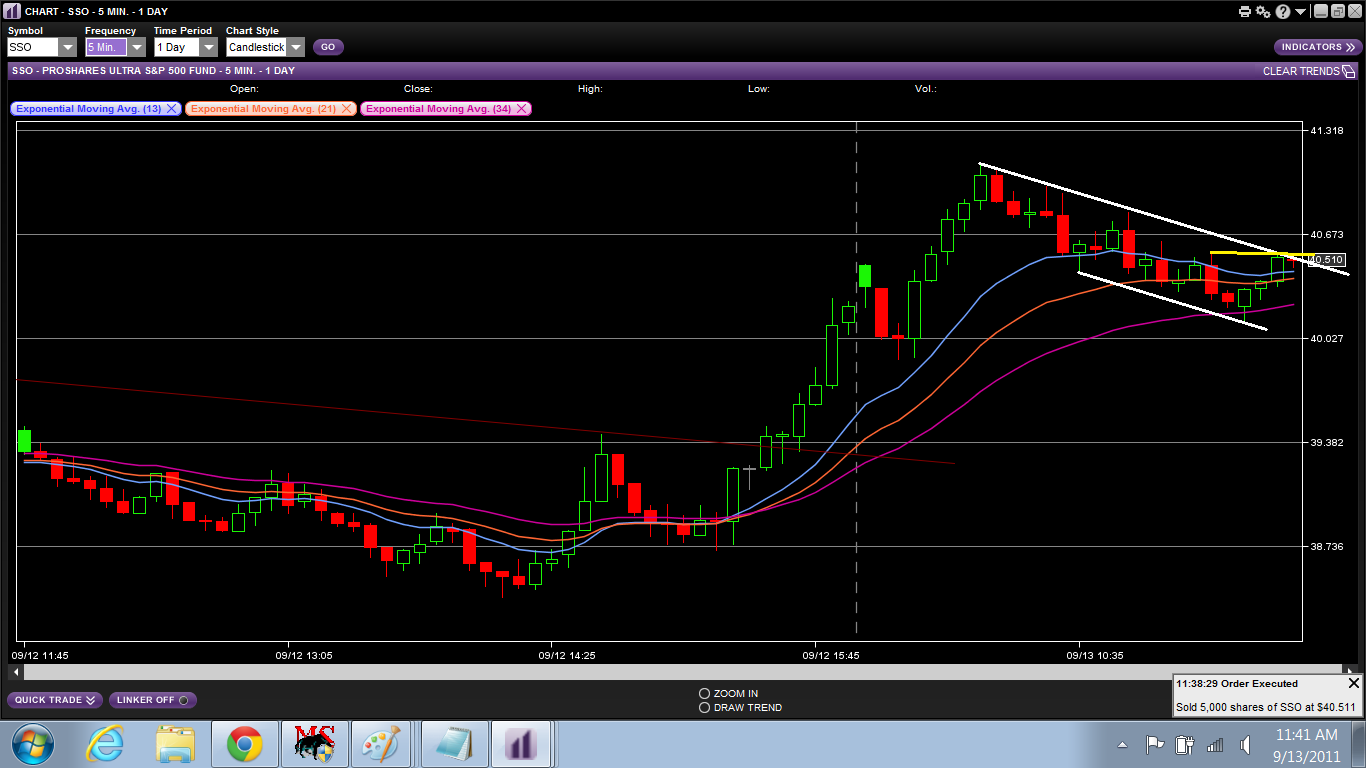
On the strength of Monday's strong performance and yesterday morning's opening rally, I bought 5,000 shares of SSO at 40.28 on the pullback to the EMAs in the 5-Minute chart. Initial resistance was the top of the channel (in white) and horizontal resistance (in yellow), at 40.54. I sold the shares just below there, for 40.51.

Nice consolidation and Falling Wedge breakout in AMZN. The highs at the horizontal yellow line were an identical 216.60. The low of the Falling Wedge was 215.40, so I expected a minimum rally to a target of 217.80 and bought 1,000 shares at 216.75 and another 1,000 shares at 216.50.
216.60 - Identical highs
215.40 - Low of the Falling Wedge
216.60 - 215.40 = 1.20 points of upside added to 216.60 = Target: 217.80 IN PLAY
The highs at the orange horizontal line were 216.95 and 217.00, a breakout above which would put an additional target of 218.50 IN PLAY.
216.95 - the more conservative of the two highs
215.40 - the low of the Falling Wedge
216.95 - 215.40 = 1.55 points added to 216.95 = Target: 218.50 IN PLAY

I sold all 2,000 shares going into the 217.80 target. My eyes were too tired to sell half and hold the other 1,000 shares for the 218.50 target, which would have given me a real decent chance at a better gain.

After I sold (white down arrow), AMZN formed and broke out of two Bulls Flags (white up arrowss). 218.50 got MADE and the stock scored an eventual session high of 219.95, capitalizing on the nested pattern/multiple pattern breakouts. Quite nice.

Gain on the session: $3,450

No comments:
Post a Comment