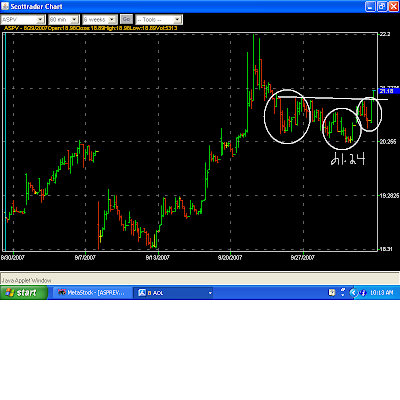
(Click Directly On The Chart For Better Viewing)
"Fractals" are repeating patterns that sometimes show up in charts. In the daily chart posted earlier this week, we saw the Inverse H&S pattern that formed, and broke out.
Breakouts often are re-tested, and we got that re-test, which was successful. While re-testing that breakout (the low was 20.24, just pennies above the neckline), an Inverse H&S "fractal" (repeating pattern) emerged on this Hourly chart. It just broke out above the neckline a few minutes ago, which suggests that ASPV is going back up to the 22's.
EDIT: The low of the Head on the chart should read 20.24, not 21.24.

No comments:
Post a Comment