Yesterday's action in the SPX gives testimony to the danger of shorting an upside technical breakout (the Symmetrical Triangle, in white), and testimony to the further danger of shorting TWO successful retests of an upside breakout, which we had on Thursday and Friday.
It was "Advantage: The Bulls" going into yesterday's session, and The Bulls pressed their advantage fully, taking the SPX up to, and through, the top of The Channel (in red).

In IBM, the Bullish Inverse H&S target of 106.45, which has been IN PLAY since the January 3, 2009 upside breakout, got MADE in yesterday's trading.

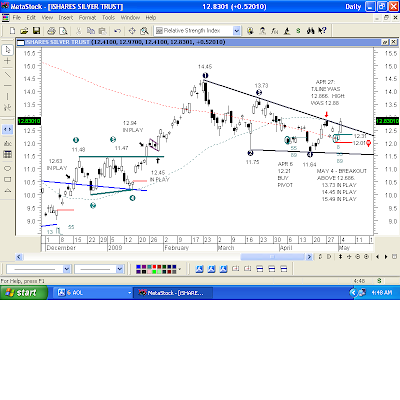
The SLV broke out of this Bullish Falling Wedge yesterday, on a print of 12.69. The 8, 55, and 89 RSIs came into Bullish Synchronicity on April 30, which means that the 12.30 high of that session is the "Buy Pivot," and that a print of 12.31 in the next session was a Buy from that particular indicator.
We had a similar Buy from the 55 and 89 RSIs in early April, but that trade would have been stopped out when the low of that session (the first candle circled in green) got taken out to the downside, at Black Data Point #4.
What I like about this second Buy signal (the second candle circled in green) is that it showed up after we established Black Data Point #4 of the Bullish Falling Wedge. Since then, we went up to the top of the Bullish Falling Wedge and failed right there, within a little over one penny. The top of the Wedge was at 12.866. The high of that session was 12.88. That established validated resistance, telling us, "Yes, that trendline IS resistance."
When validated resistance gets taken out, that "should" have some significance. Not only did that 12.88 high get taken out yesterday, it got taken out on an upside technical breakout of the Bullish Falling Wedge. I like that.
On a pullback for a retest of the top of the Bullish Falling Wedge, the slope is -0.036, so it will come in today, May 5, at 12.65.
The upside targets IN PLAY, listed on the chart, are Black Data Point #3, Black Data Point #1, and the measured move off the pattern breakout, respectively.
14.45 - High of the pattern
11.64 - Low of the pattern
14.45 - 11.64 = 2.81 points of upside, added to the point of the breakout.
2.81 + 12.68 = Target: 15.49 IN PLAY

2 comments:
Just noticed (4:45AM) that the SLV had an upside technical breakout of a Bullish Falling Wedge yesterday, so I'm going to add that chart and analysis to this morning's post in a few minutes.
The SLV is indicated BID: 13.33...ASK: 13.34. Curses! LOL.
Post a Comment