
This Triple Top/Ascending Triangle breakout on Monday was what launched the current rally. Notice that after the breakout, 48.50, the lowest of the three tops, became support.
"After a breakout, former resistance 'should be' support on a selloff." It was.

The Triple Top/Ascending Triangle breakout on Monday was followed up with a TRIPLE breakout above TRIPLE validated resistance, similar in effect to the Ascending Triangle breakout of May 25, above QUINTUPLE validated resistance (five red arrows). FCX rallied, the Ascending Triangle target of 52,28 got MADE, then the stock validated resistance at the top of the Falling Wedge after five consecutive, unsustainable gaps higher.
Both rallies were/are driven by "buying begets buying." Shorts are squeezed on the breakouts (in this case four breakouts) as the trade moves against them and longs step in and buy. As an example of that, I mentioned at the FCX Board yesterday that the shorts would get some respite if FCX traded back below 49.65, the top of the Triple Validated resistance, after the Triple Breakout. They only got two minutes of respite when the stock traded down to 49.61, then the pressure to buy was on again into the close, and into early today when the Bull Flag target of 51.07 and the Symmetrical Triangle target of 52.19 both got MADE.
"Don't be caught short an upside technical breakout." Especially not short four pattern breakouts, above Triple Validated Resistance. UGH.
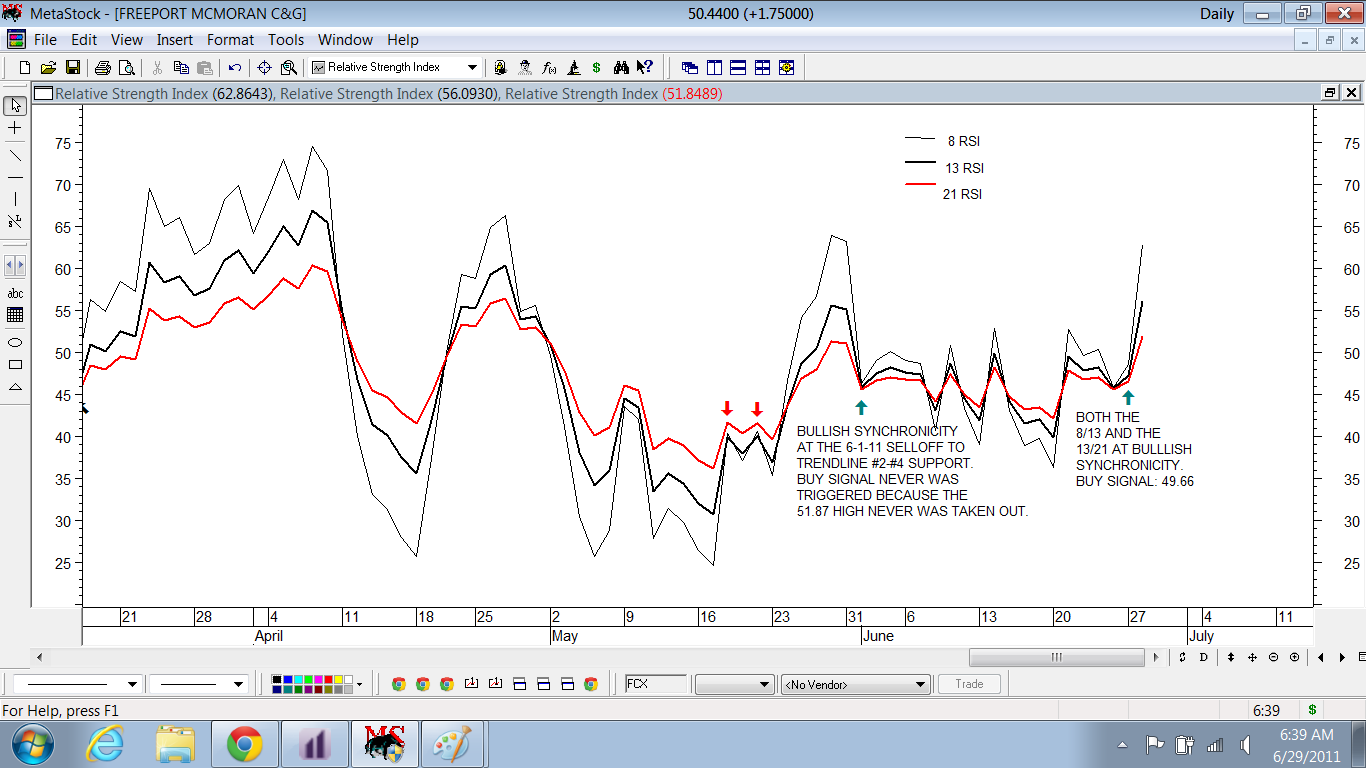
Both the 8/13 and the 13/21 Fibonacci Sequential Measures of Relative Strength gave their first buy signals in many moons, on yesterday's Triple Breakout and print of 49.66, above Triple Validated Resistance. Signals like that in conjunction with breakouts tend to be very supportive of a rally, ala, "We're ready for liftoff, Houston!"

Basis the Ichimoku Kinko Hyo chart, FCX closed yesterday at the "bottom rung" of Kumo (Cloud) resistance, which was from 50.25 up to 52.405. Today's rally got above the Kumo, to 52.62, then pulled back. The May 31 high was 52.70, where FCX failed at the bottom of the Kumo. The May 10 rally high of 52.30 also failed at Kumo (Cloud) resistance. Today's move to 52.62 is the first print above the Kumo in nearly two month's time.

4 comments:
Wow . .lovely . .the Kumo cloud is fascinating to me. Have never been exposed to it before. Melf, this is meaty stuff . . it is anything but tedious :-) Thank you, Professor.
Mary
Mary,
I'm glad that you enjoy it. The Kumo (Cloud) really fascinates me, too ;)
I too find the clouds interesting as a type of reference but complex and I'm still figuring them out. They sort of seem like a boll band to me. I want to go through your writeup again and absorb clarity.
I was reading up on Symmetrical Continuation Triangle. Is this same terminology as Ascending Triangle? Here's what I read about it and there's a nice chart of FCX to go with it with the trendlines and triangles drawn. Can images be attached here for you to see?
"The price has broken upward out of a consolidation period, suggesting a continuation of the prior uptrend. A Symmetrical Continuation Triangle (Bullish) shows two converging trendlines as prices reach lower highs and higher lows. Volume diminishes as the price swings back and forth between an increasingly narrow range reflecting uncertainty in the market direction. Then well before the triangle reaches its apex, the price breaks out above the upper trendline with a noticeable increase in volume, confirming the pattern as a continuation of the prior uptrend."
Jim,
The difference between an Ascending Triangle and a Symmetrical Triangle is that with the former, the top of the pattern is flat and the lower trandline "ascends." With the latter, the lower trendline also ascends, but the top trendline is descending, rather than flat, as in an Ascending Triangle.
Example of an Ascending Triangle:
The first chart in this thread, which is an intraday chart, with the flat highs of 48.52 ... 48.50 ... 48.54. Sometimes there are only two data points for the flat top. This one had three.
Example of a Symmetrical Triangle:
The four days prior to the Triple Breakout, which is the pattern in purple, numbered 1 through 4. These patterns "can be" continuation patterns, but this one wasn't. It was what I call a "nested" pattern. It was "nested" within the Blue Channel, and the Blue Channel was was "nested" within the Big Falling Wedge.
"Nested" patterns seem to me to act like a compression of energy. When the energy is released (the Triple Breakout) ... KABOOM.
Yes, the clouds are interesting as a type of reference point. I like how you put that. We're ALWAYS going to be trying to figure them out, like anything else in technical analysis. View them as a piece of the puzzle, in context with what the chart is doing vis a vis the cloud.
For example, FCX has been trading below the cloud for about two month's time. The stock found resistance at the bottom of the cloud on May 10 and again on May 31. Tuesday's Triple Breakout through Triple Validated Resistance got FCX back to the bottom of the cloud. How well do we like FCX's chances of at least getting to the top of the cloud, at 52.405, near the Symmetrical Triangle target of 52.19? How well do we like FCX's chances of eventually getting through the cloud on the current rally?
You can't post a chart here, but you can post a link to a chart. When you're looking at a chart, right click on your browser and click "Select All." Right click on your browser again and click "Copy." Then come to the Comment Section, right click, then click "Paste" and the link to your chart will appear.
Post a Comment